This is the first of two posts on the pedestrian survey strategies used by the Issei at Barneston Project during the 2016 and 2017 field seasons. The second post can be found here.
Pedestrian surveys, in a nutshell, amount to walking across the landscape and looking at the ground, albeit in a slower and more systematic manner than walking, say, to the grocery store! Our pedestrian survey suffered from some visibility issues. There is a lot of tree and plant cover at the Barneston site, and it wasn’t always easy to see the ground around you (Figures 1 and 2). But, we managed to identify a number of important features, which we could then use to define new areas for more intensive survey.
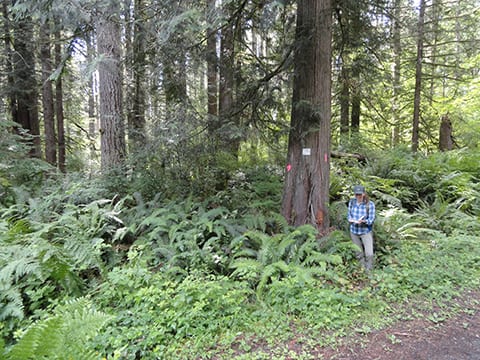
Figure 1. A portion of the site at Barneston, prior to our work there. As you can see, visibility at this site is rather poor. Volunteer Anna Cohen is in the foreground for scale. She’s laughing because she had no idea that Pacific Northwest forests could be as thick as those she sees in her work in Guatemala. Photograph by David Carlson. Please contact David before using, reproducing, or altering this image.
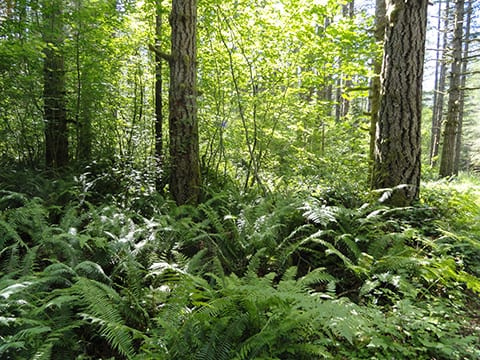
Figure 2. Another shot of the Barneston site, to give you a sense of the visibility here.
When an archaeologist decides to do a pedestrian survey, they need to make a number of decisions, including (but not limited to):
- What is their survey universe?
- What is their survey strategy?
- How will they record what they find?
Surveys are fundamentally about sampling. What I mean by this is that you cannot actually visit every piece and speck of ground in you project area, record every single feature or artifact, or collect everything you find. For a variety of reasons—some involving logistics, others involving the very nature of scientific and historical research—you have to base your investigation off of a portion of whatever it is you are looking at. That portion is a sample.
Because of this, doing a pedestrian survey involves making a number of decisions about where you will look and how you will look. The technical term for where you look is your survey universe, the areas you are actually going to be walking over. The “how” is referred to as your survey strategy, the guidelines for how you will collect your data.
In this case, our survey universe was an area centered on the hypothetical location of Barneston’s Nikkei community, which we established through archival research (Figure 3). The survey universe is larger than the actual community, because (a) our data is based off a 1911 map, and it’s possible the community grew larger afterwards, and (b) people may have done activities (such as moonshining alcohol or dumping trash) outside of but near to the boundaries of the community. Because of this, it is important that we survey an area that is larger than the community itself.
Figure 3. Survey Universe for Barneston. Created by David Carlson.
When it comes to recording, you have lots of options and decisions, which I cover other blog posts. However, for this survey, we used a total station to record our transects and finds and a Trimble Pro XH GPS unit to supplement the total station. In the first season (2016), we collected any artifacts we found, though some of the larger pieces of metal were left in situ (in their original position, uncollected). In the second season (2017), we left objects where they laid.