This is the second of two posts on the pedestrian survey strategies used by the Issei at Barneston Project during the 2016 and 2017 field seasons. The first post can be found here.
2016 Survey Strategy
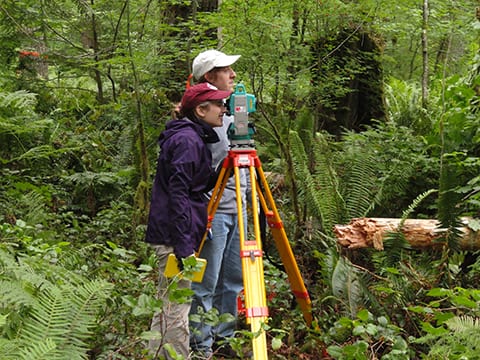
When I first visited the site in 2016, my survey strategy was a systematic pedestrian survey, with magnetic North-South transects cut into the forest every 25m from east to west. “Systematic” means that, once the start point was chosen, we calculate the location of each additional place we will survey based on a regular interval. You already know what pedestrian survey means. “Transects” are survey lines; one or more individuals walks across them, looking left, right, and down, trying to find surface features or artifacts. Once found, these are mapped in with a total station (Figure 1). Due to the overgrowth, I looked primarily for surface features; many of the artifacts we have found were found in association with them, and as I will explain later, even without that overgrowth, many artifacts are hidden under a thin layer of plant remains and humic material.

Figure 1. Hollis Miller and Sam Hordeski on the total station. Please contact David before using, reproducing, or altering this image.
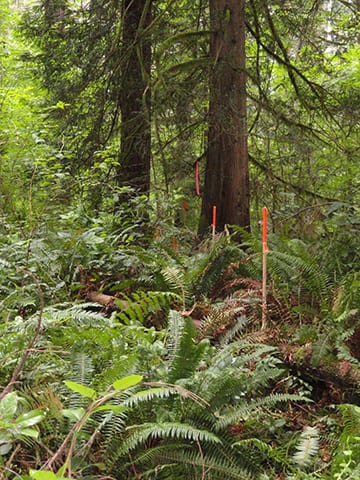
Each transect was cut from north to south for 50 or so meters, at which point we moved 25 meters east to the next transect. Every 10 meters, we took a topographic point with the total station and hammered in a 5-ft stake. The stakes are used both as guides and as local datums for any features we find (Figure 2). Any features or artifacts found were also mapped in, albeit without stakes.
March 2017 Survey Strategy

Figure 2. A line of guiding stakes.
In March of 2017, I returned to the site to conduct another pedestrian survey. My reasoning here was two-fold. First, I wanted to explore further north of the community. I felt that north was the most likely location for them to expand, if they needed to. They were bordered by loading docks to the south and a large gorge to the east, which restricted expansion in those directions. Second, I wanted to conduct a closer-interval survey. Twenty-five meters was fine to start with; it was basically a more formal kind of reconnaissance. But my own research interests, as well as the guidelines for archaeological work on the watershed, required a closer-interval survey.
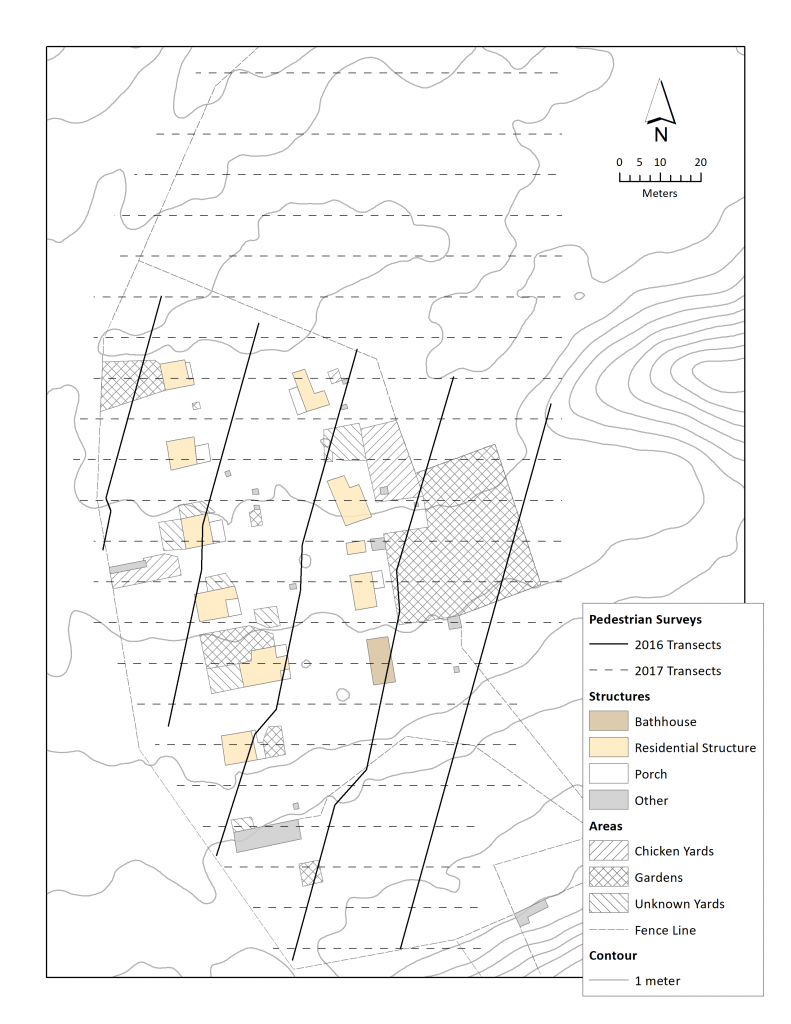
So, in the course of five very rainy, very cold days in March 2017, I conducted a systematic pedestrian survey oriented true east-west at 10 meter intervals. I played around with different distances (e.g. 5, 10) before settling on 10 meters. While the ground itself was still difficult to see, the surrounding foliage had largely died off. This allowed me to see at least 20 meters horizontally in any direction. Once again, due to ground cover, I focused on surface features. I did not have enough helpers for the total station, and so finds were recorded using a compass and measuring tape. I used the stakes I laid in in my 2016 survey to guide me. Figure 3 below shows the area covered by this and previous surveys.

Figure 3. Pedestrian survey transects, 2016-2017. Created by David Carlson.
I did not collect any material culture this time, because I did not need to. The stuff I recovered in 2016 was enough to establish the viability of this site, and there was no further need (at this time) to collect individual finds.
This more or less completed the projects pedestrian survey. Since then, we have moved on to more intensive surveys in smaller areas, which I will write about in a future post.
