Category Archives: Survey

Surface Collection

At the end of the 2016 field season (see Parts One and Two of our posts on pedestrian survey), Hollis and I set up a grid for surface collection on an artifact scatter in the northeastern-most area of the site. Surface collection is a tried-and-true method of identifying archaeological sites and areas-of-interest in historical archaeology. Very often, much of what we are interested in historical archaeology it is on, near, or predicted by what is on the surface. This is particularly true here, where the site isn’t very old and there is probably not a lot of dirt being deposited on the ground over time. Our goal for this surface collection was to get a sample of artifacts from the site. We could use this sample to justify future funding, as well as to plan out our laboratory analysis techniques (for when we recover more artifacts!).
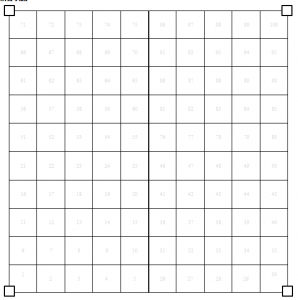
Scan of our field forms showing an idealized grid.

Figure 1: Scan of our field forms showing an idealized grid. Scan by David Carlson.

Our surface collection strategy involved setting up a 2-meter grid in a 20- by 20-meter area. This gives us 100 quadrats, or grid squares, to investigate (Figures 1 and 2). Each square is given a unique identifier, so we can make sure to keep all artifacts we find in it together. There are two reasons for picking this method. First, it means we don’t have to decide what to point plot. One way of collecting surface material is to take a GPS or total station and record either every artifact you find, or centerpoints for collections of artifacts. Recording every artifact is time consuming, given that most are going to be small fragments. It also means you either have to use a total station or a really good GPS unit, as most GPS units will not have enough precision for what you want. Recording clusters of artifacts is easier, but more arbitrary (how do you define a cluster?) and is difficult to visualize and analyze in a GIS. By collecting everything within a quadrat, we avoid dealing with some of these issues.

Figure 2. Gridded and cleared area of surface collection. Photo by David Carlson.

Second, it lets us systematically clear the surface. For each square, we scraped the surface with trowels and 1/8″ screened the surface debris. We scraped the surface to clear away mold, tree and root debris, and loose material. Once we could see dirt (or humus), we stopped (Figure 3). The reason for this is that much of the site is covered not only in living plants, but in not-yet-decayed plant remains. So even if you clear all plant growth (which we also did), your surface artifacts may still be obscured by recent plant matter. Setting up grid squares allowed us to systematically clear each square in its entirety, revealing a great deal more material than we would have found otherwise and giving us a better estimate of the below-surface distribution of artifacts. It also meant that when we screened the material we cleared (to find any small artifacts caught up in it), we knew where in space the screened material came from and had control over how we collected it.
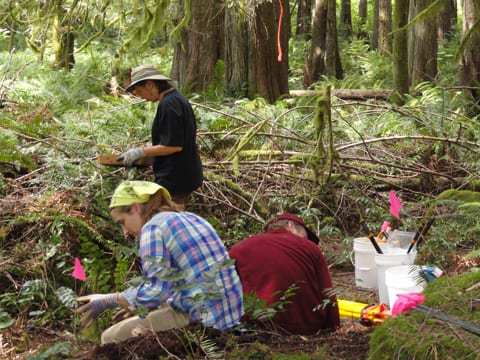
Figure 3. Hollis Miller, Sam Hordeski, and Joyce LeCompte-Mastenbrook help clear a quadrat. Photo by David Carlson. Please contact David before using, reproducing, or altering this image.

This survey took a week or so’s worth of time, but was extremely valuable in both confirming the date of the site and in justifying future research. I may post more about the results of this collection in the future, as long as I can figure out a way to do so without talking too much about the artifacts we found (see the FAQ for further explanation).

Pedestrian Survey, Part 2

This is the second of two posts on the pedestrian survey strategies used by the Issei at Barneston Project during the 2016 and 2017 field seasons. The first post can be found here.

2016 Survey Strategy

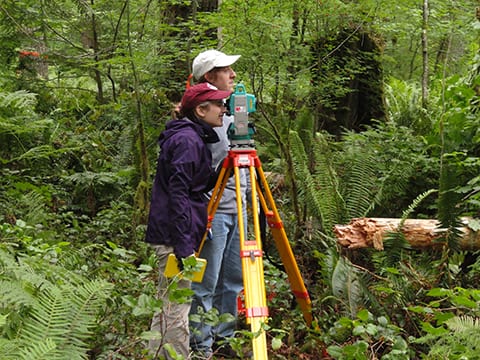
When I first visited the site in 2016, my survey strategy was a systematic pedestrian survey, with magnetic North-South transects cut into the forest every 25m from east to west. “Systematic” means that, once the start point was chosen, we calculate the location of each additional place we will survey based on a regular interval. You already know what pedestrian survey means. “Transects” are survey lines; one or more individuals walks across them, looking left, right, and down, trying to find surface features or artifacts. Once found, these are mapped in with a total station (Figure 1). Due to the overgrowth, I looked primarily for surface features; many of the artifacts we have found were found in association with them, and as I will explain later, even without that overgrowth, many artifacts are hidden under a thin layer of plant remains and humic material.

Figure 1. Hollis Miller and Sam Hordeski on the total station. Please contact David before using, reproducing, or altering this image.

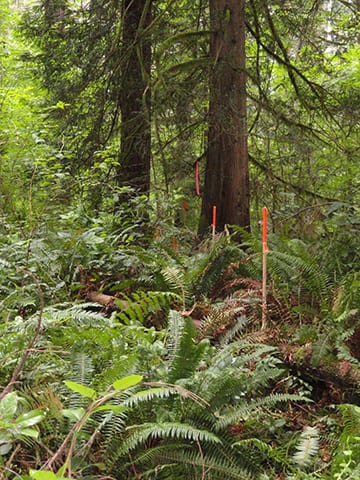
Each transect was cut from north to south for 50 or so meters, at which point we moved 25 meters east to the next transect. Every 10 meters, we took a topographic point with the total station and hammered in a 5-ft stake. The stakes are used both as guides and as local datums for any features we find (Figure 2). Any features or artifacts found were also mapped in, albeit without stakes.

March 2017 Survey Strategy

Figure 2. A line of guiding stakes.

In March of 2017, I returned to the site to conduct another pedestrian survey. My reasoning here was two-fold. First, I wanted to explore further north of the community. I felt that north was the most likely location for them to expand, if they needed to. They were bordered by loading docks to the south and a large gorge to the east, which restricted expansion in those directions. Second, I wanted to conduct a closer-interval survey. Twenty-five meters was fine to start with; it was basically a more formal kind of reconnaissance. But my own research interests, as well as the guidelines for archaeological work on the watershed, required a closer-interval survey.

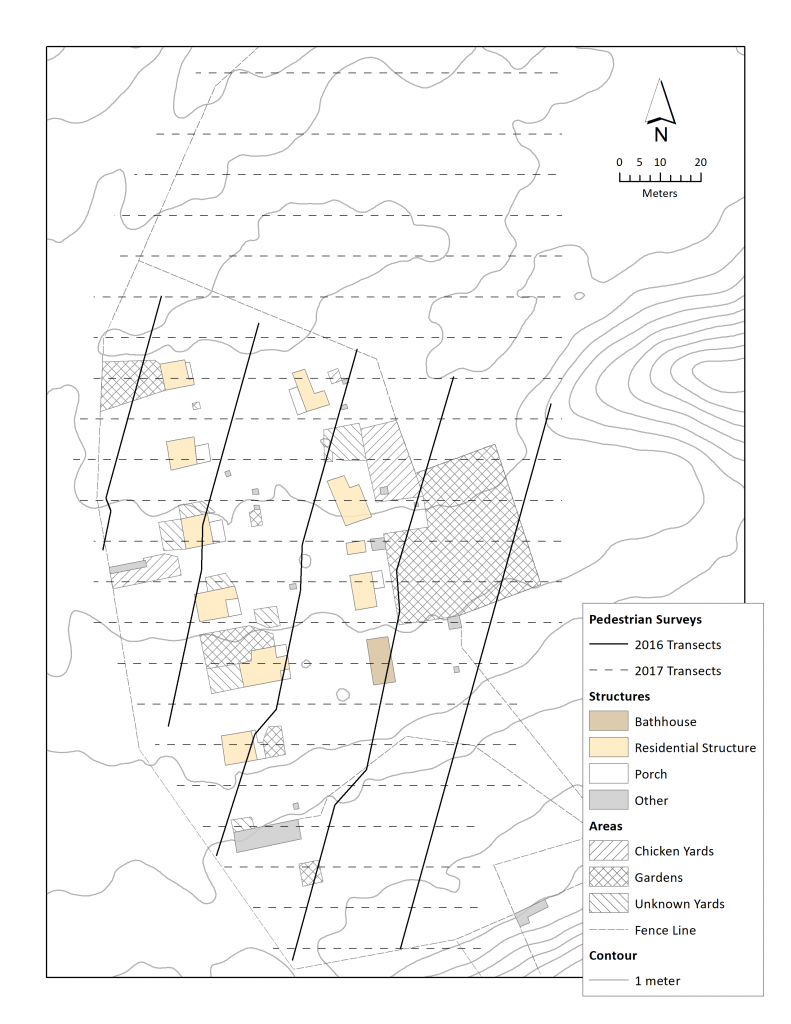
So, in the course of five very rainy, very cold days in March 2017, I conducted a systematic pedestrian survey oriented true east-west at 10 meter intervals. I played around with different distances (e.g. 5, 10) before settling on 10 meters. While the ground itself was still difficult to see, the surrounding foliage had largely died off. This allowed me to see at least 20 meters horizontally in any direction. Once again, due to ground cover, I focused on surface features. I did not have enough helpers for the total station, and so finds were recorded using a compass and measuring tape. I used the stakes I laid in in my 2016 survey to guide me. Figure 3 below shows the area covered by this and previous surveys.

Figure 3. Pedestrian survey transects, 2016-2017. Created by David Carlson.

I did not collect any material culture this time, because I did not need to. The stuff I recovered in 2016 was enough to establish the viability of this site, and there was no further need (at this time) to collect individual finds.

This more or less completed the projects pedestrian survey. Since then, we have moved on to more intensive surveys in smaller areas, which I will write about in a future post.

Pedestrian Survey, Part 1

This is the first of two posts on the pedestrian survey strategies used by the Issei at Barneston Project during the 2016 and 2017 field seasons. The second post can be found here.

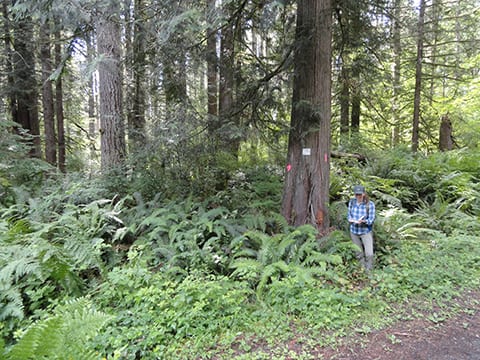
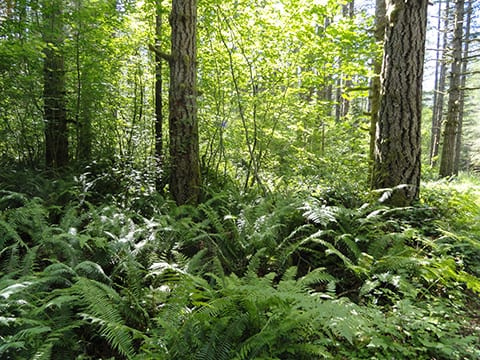
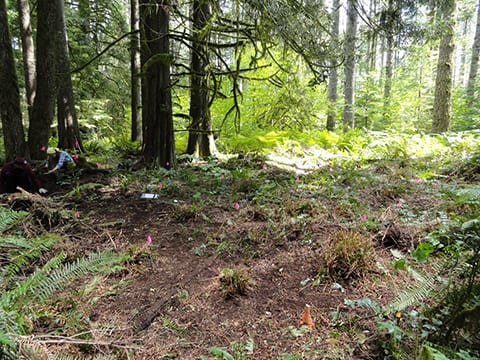
Pedestrian surveys, in a nutshell, amount to walking across the landscape and looking at the ground, albeit in a slower and more systematic manner than walking, say, to the grocery store! Our pedestrian survey suffered from some visibility issues. There is a lot of tree and plant cover at the Barneston site, and it wasn’t always easy to see the ground around you (Figures 1 and 2). But, we managed to identify a number of important features, which we could then use to define new areas for more intensive survey.

Figure 1. A portion of the site at Barneston, prior to our work there. As you can see, visibility at this site is rather poor. Volunteer Anna Cohen is in the foreground for scale. She’s laughing because she had no idea that Pacific Northwest forests could be as thick as those she sees in her work in Guatemala. Photograph by David Carlson. Please contact David before using, reproducing, or altering this image.

Figure 2. Another shot of the Barneston site, to give you a sense of the visibility here.

When an archaeologist decides to do a pedestrian survey, they need to make a number of decisions, including (but not limited to):

  1. What is their survey universe?
  2. What is their survey strategy?
  3. How will they record what they find?

Surveys are fundamentally about sampling. What I mean by this is that you cannot actually visit every piece and speck of ground in you project area, record every single feature or artifact, or collect everything you find. For a variety of reasons—some involving logistics, others involving the very nature of scientific and historical research—you have to base your investigation off of a portion of whatever it is you are looking at. That portion is a sample.

Because of this, doing a pedestrian survey involves making a number of decisions about where you will look and how you will look. The technical term for where you look is your survey universe, the areas you are actually going to be walking over. The “how” is referred to as your survey strategy, the guidelines for how you will collect your data.

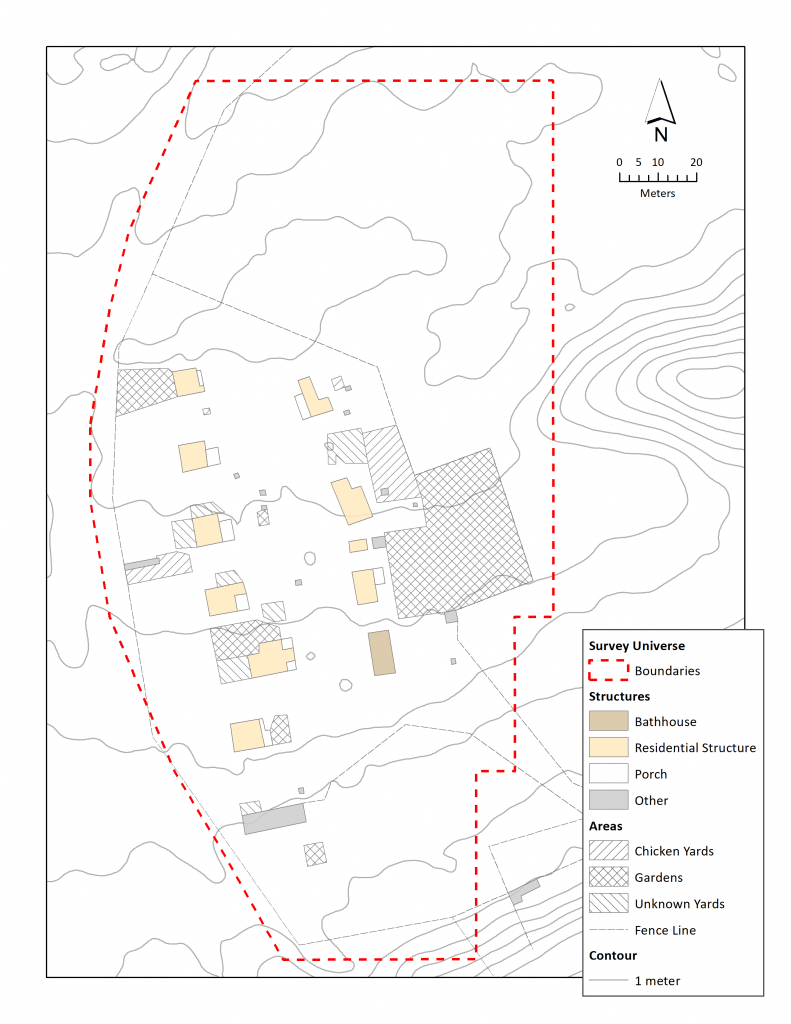
In this case, our survey universe was an area centered on the hypothetical location of Barneston’s Nikkei community, which we established through archival research (Figure 3). The survey universe is larger than the actual community, because (a) our data is based off a 1911 map, and it’s possible the community grew larger afterwards, and (b) people may have done activities (such as moonshining alcohol or dumping trash) outside of but near to the boundaries of the community. Because of this, it is important that we survey an area that is larger than the community itself.

Figure 3. Survey Universe for Barneston. Created by David Carlson.

When it comes to recording, you have lots of options and decisions, which I cover other blog posts. However, for this survey, we used a total station to record our transects and finds and a Trimble Pro XH GPS unit to supplement the total station. In the first season (2016), we collected any artifacts we found, though some of the larger pieces of metal were left in situ (in their original position, uncollected). In the second season (2017), we left objects where they laid.