Pedestrian Survey, Part 2

This is the second of two posts on the pedestrian survey strategies used by the Issei at Barneston Project during the 2016 and 2017 field seasons. The first post can be found here.

2016 Survey Strategy

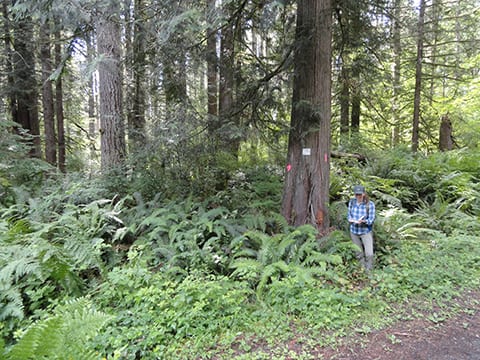
When I first visited the site in 2016, my survey strategy was a systematic pedestrian survey, with magnetic North-South transects cut into the forest every 25m from east to west. “Systematic” means that, once the start point was chosen, we calculate the location of each additional place we will survey based on a regular interval. You already know what pedestrian survey means. “Transects” are survey lines; one or more individuals walks across them, looking left, right, and down, trying to find surface features or artifacts. Once found, these are mapped in with a total station (Figure 1). Due to the overgrowth, I looked primarily for surface features; many of the artifacts we have found were found in association with them, and as I will explain later, even without that overgrowth, many artifacts are hidden under a thin layer of plant remains and humic material.

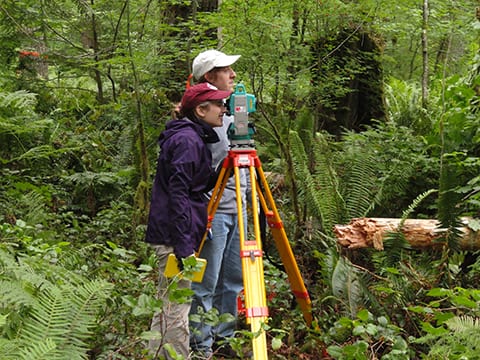
Figure 1. Hollis Miller and Sam Hordeski on the total station. Please contact David before using, reproducing, or altering this image.

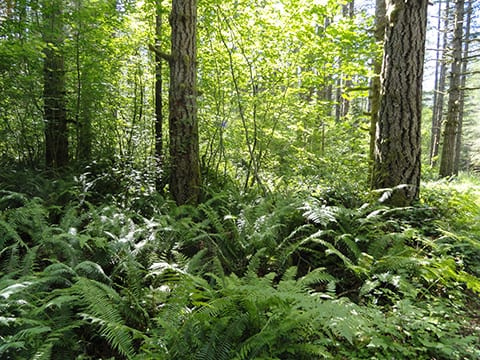
Each transect was cut from north to south for 50 or so meters, at which point we moved 25 meters east to the next transect. Every 10 meters, we took a topographic point with the total station and hammered in a 5-ft stake. The stakes are used both as guides and as local datums for any features we find (Figure 2). Any features or artifacts found were also mapped in, albeit without stakes.

March 2017 Survey Strategy

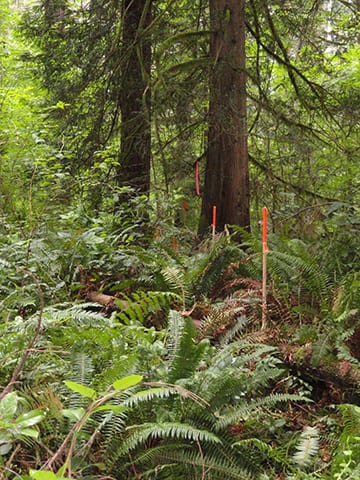
Figure 2. A line of guiding stakes.

In March of 2017, I returned to the site to conduct another pedestrian survey. My reasoning here was two-fold. First, I wanted to explore further north of the community. I felt that north was the most likely location for them to expand, if they needed to. They were bordered by loading docks to the south and a large gorge to the east, which restricted expansion in those directions. Second, I wanted to conduct a closer-interval survey. Twenty-five meters was fine to start with; it was basically a more formal kind of reconnaissance. But my own research interests, as well as the guidelines for archaeological work on the watershed, required a closer-interval survey.

So, in the course of five very rainy, very cold days in March 2017, I conducted a systematic pedestrian survey oriented true east-west at 10 meter intervals. I played around with different distances (e.g. 5, 10) before settling on 10 meters. While the ground itself was still difficult to see, the surrounding foliage had largely died off. This allowed me to see at least 20 meters horizontally in any direction. Once again, due to ground cover, I focused on surface features. I did not have enough helpers for the total station, and so finds were recorded using a compass and measuring tape. I used the stakes I laid in in my 2016 survey to guide me. Figure 3 below shows the area covered by this and previous surveys.

Figure 3. Pedestrian survey transects, 2016-2017. Created by David Carlson.

I did not collect any material culture this time, because I did not need to. The stuff I recovered in 2016 was enough to establish the viability of this site, and there was no further need (at this time) to collect individual finds.

This more or less completed the projects pedestrian survey. Since then, we have moved on to more intensive surveys in smaller areas, which I will write about in a future post.

Pedestrian Survey, Part 1

This is the first of two posts on the pedestrian survey strategies used by the Issei at Barneston Project during the 2016 and 2017 field seasons. The second post can be found here.

Pedestrian surveys, in a nutshell, amount to walking across the landscape and looking at the ground, albeit in a slower and more systematic manner than walking, say, to the grocery store! Our pedestrian survey suffered from some visibility issues. There is a lot of tree and plant cover at the Barneston site, and it wasn’t always easy to see the ground around you (Figures 1 and 2). But, we managed to identify a number of important features, which we could then use to define new areas for more intensive survey.

Figure 1. A portion of the site at Barneston, prior to our work there. As you can see, visibility at this site is rather poor. Volunteer Anna Cohen is in the foreground for scale. She’s laughing because she had no idea that Pacific Northwest forests could be as thick as those she sees in her work in Guatemala. Photograph by David Carlson. Please contact David before using, reproducing, or altering this image.

Figure 2. Another shot of the Barneston site, to give you a sense of the visibility here.

When an archaeologist decides to do a pedestrian survey, they need to make a number of decisions, including (but not limited to):

  1. What is their survey universe?
  2. What is their survey strategy?
  3. How will they record what they find?

Surveys are fundamentally about sampling. What I mean by this is that you cannot actually visit every piece and speck of ground in you project area, record every single feature or artifact, or collect everything you find. For a variety of reasons—some involving logistics, others involving the very nature of scientific and historical research—you have to base your investigation off of a portion of whatever it is you are looking at. That portion is a sample.

Because of this, doing a pedestrian survey involves making a number of decisions about where you will look and how you will look. The technical term for where you look is your survey universe, the areas you are actually going to be walking over. The “how” is referred to as your survey strategy, the guidelines for how you will collect your data.

In this case, our survey universe was an area centered on the hypothetical location of Barneston’s Nikkei community, which we established through archival research (Figure 3). The survey universe is larger than the actual community, because (a) our data is based off a 1911 map, and it’s possible the community grew larger afterwards, and (b) people may have done activities (such as moonshining alcohol or dumping trash) outside of but near to the boundaries of the community. Because of this, it is important that we survey an area that is larger than the community itself.

Figure 3. Survey Universe for Barneston. Created by David Carlson.

When it comes to recording, you have lots of options and decisions, which I cover other blog posts. However, for this survey, we used a total station to record our transects and finds and a Trimble Pro XH GPS unit to supplement the total station. In the first season (2016), we collected any artifacts we found, though some of the larger pieces of metal were left in situ (in their original position, uncollected). In the second season (2017), we left objects where they laid.

Issei Life and Work at Barneston

This post is the final one in a series of three concerning the specific history of Barneston, Washington. The first one can be found here, at “A Brief History of Barneston,” and the second here, “The Nikkei Community at Barneston.” This post draws upon material published in my 2017 article in Archaeology in Washington.

This project’s current knowledge of life and work at Barneston comes from a combination of oral testimonies and census data. The 1910 and 1920 federal censuses include occupational data, which provide some insights into the kinds of labor Issei did at Barneston (U.S. Census 1910, 1920). A synthesis of this data is presented on Tables 1 and 21. These tables are meant to be read left-to-right, row by row. The data reflect a broader industry trend towards hiring Issei largely as general labor (Dubrow et al. 2002; Olson 1927). A more detailed look shows that, while this trend plays out in both 1910 and 1920, it may have been more severe in the later period. Occupations listed on the 1910 census consist of: boarding house operator, driver, grader, planerman, sawyer, trucker, and general laborer (in either the sawmill or planing mill). The 1920 census shows a drop in the diversity of listed occupations, with only general laborer, foreman, and cook represented.

I am still reconstructing what each of these positions may have entailed, but based on a 1972 U.S. Department of the Army (U.S. Army) technical manual on logging and sawmill operation, this shift may represent a loss of responsibility and access to skilled positions for the Issei, possibly in response to rising anti-Japanese hysteria after World War I. Graders, for example, were in charge of classifying the quality of the lumber produced, and sawyers were responsible for the proper operation of sawmill machinery (U.S. Army 1972:Glossary 5). The technical manual remarks that “quality and quantity of lumber sawed depends on [the sawyer’s] judgement, skill, and speed” (U.S. Army 1972:Glossary 10). This does not seem to be the result of any change in how the census is gathered, as an even more diverse array of jobs—including sawyer and grader—are recorded for non-Japanese workers of both periods. The absence of Issei in such positions in 1920, then, may represent the a more severe example of the differential hiring practices already present in 1910.

Table 1. Proportions of workers at Barneston by occupational category and region of birth – 1910
Occupational Category1 Japan U.S. Europe2 Other
Engineering and Repair 44% 56%
General Labor 83% 7% 10%
Managerial 100%
Specific Labor 45% 30% 20% 5%
Other 100%
Unknown 29% 29% 42%
Table 2. Proportions of workers at Barneston by occupational category and region of birth – 1920
Occupational Category1 Japan U.S. Europe2 Other
Engineering and Repair 57% 36% 7%
General Labor 69.5% 18.5% 6% 6%
Managerial 33% 67%
Specific Labor 61% 32% 7%
Other 11% 67% 11% 11%
Unknown 50% 25% 25%

The remaining current knowledge of the lives of these immigrants is based heavily on oral testimonies collected by University of Washington students in the 1990s (Brown and Schroeder 1996; Gilbert and Woodman 1995). These suggest that most of the buildings in the Nikkei community were occupied by four single men. The rest were occupied by families, who occasionally built small extensions of their houses for new family members (with company permission). The bathhouse in the southwest camp was an important corporate structure; communal bathing has strong cultural significance in Japan, and the bathhouse operated in a traditional manner, with men bathing before women and children.  Informants also report that they used the local town store only occasionally, preferring instead to either to go Nikkei shops in Seattle or order food from East Asian-owned companies that made monthly deliveries to the site. Many supplies were ordered cooperatively, including food, which was cooked by an Issei cook working out of the bathhouse, though I am not yet sure if she cooked solely for the bachelors or also assisted the families. These economic connections, plus the fact that Seattle was the port through which most Issei immigrants came, produced strong ties between Barneston and the Seattle Nikkei community (Brown and Schroeder 1996; Gilbert and Woodman 1995).

Notes

1. Occupational categories were created to simply the very diverse array of jobs reported on the U.S. Census. Sawmill operations involve a considerable number of specialized roles, and I have tried to condense these roles as best as possible to illustrate the disparities in hiring and labor among various racial and ethnic groups. Engineering and Repair refers to occupations tasked with the maintenance of the mill (e.g. engineers, millwrights). Managerial are those who have some managerial control over mill operations (e.g. supervisors, foremen). Specific Labor refers to those whose census entry indicated that they performed some specific role in mill operations, such as graders (who graded the quality of the wood) or sawyers (key personnel who ensured that the wood was cut appropriately). General labor refers to those listed as “laborer”, who had no specific task associated with them. Other refers to other occupations (e.g. cook), and unknown to those occupations I could not comfortably classify or for those census entries I could not decipher.

2. “Europe” covers a very broad area, and there’s evidence that the people who operated sawmill towns treated (or would have liked to treat) different groups of Europeans differently (Beda 2014; Carlson 2017). Northern Europeans, for example, were valued for their skill (since the immigrants coming over from Northern Europe often had experience in their own countries’ lumber industries), but were also seen as more likely to be union-friendly. Despite this, I have combined all of Europe together to simplify the table and highlight the degree of labor segregation on the towns.