Skip to content

New critical review of wildland fire impacts on air quality

Dr. Dan Jaffe is the lead author on a critical review that examines the processes that influence wildfires and prescribed fires and their effects on air quality in the U.S. This review, “Wildfire and prescribed burning impacts on air quality in the United States,” is published in the June issue of the Journal of the Air & Waste Management Association. This paper is the result of a collaboration between Dan Jaffe and Susan O’Neill, Narasimhan Larkin, Amara Holder, David Peterson, Jessica Halofsky, and Ana Rappold. These coauthors have brought their range of expertise to the issues related to wildland fires and have examined each of the processes influencing these fires and also the effects of the fires, “including the natural role of wildland fire, forest management, ignitions, emissions, transport, chemistry, and human health impacts.”

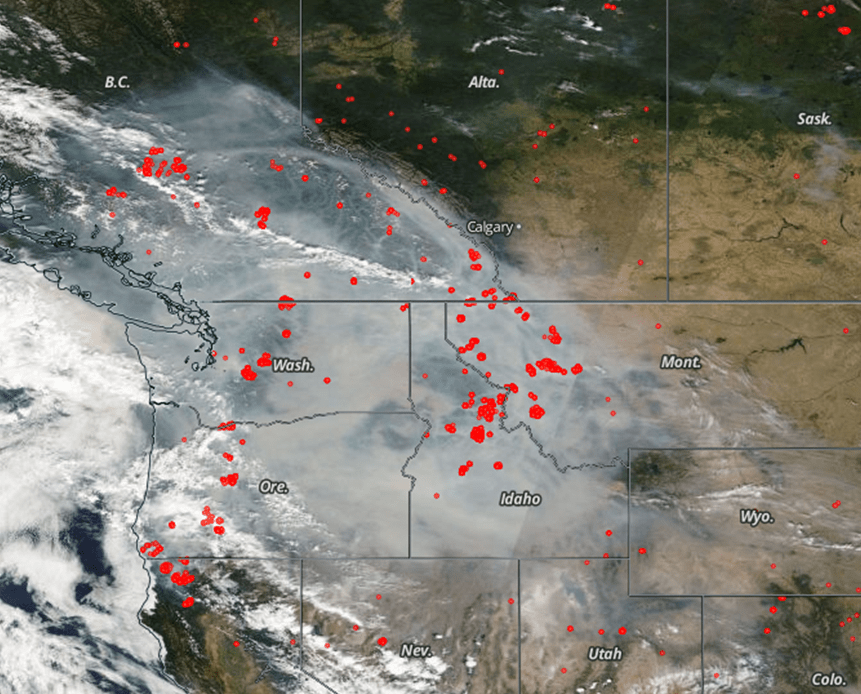
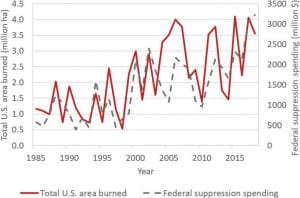
Large wildfires in the U.S. are becoming more common, and their emissions of particulate matter (PM) and gaseous compounds negatively impact air quality and human health. The air quality trend in the U.S. has been improving in the last decades. However, seasonal wildfires threaten to undermine this progress in parts of the country. The area burned by wildland fires has grown significantly in the last few decades due to “past forest management practices, climate change, and other human factors.” This has resulted in millions of people experiencing high levels of air pollution. As cities and towns have spread further into wildlands, costs for fire suppression (to protect human developments) and the consequences of fires have increased significantly.

U.S. wildire area burned and federal suppression costs for 1985-2018
Total U.S. wildfire area burned (ha) and federal suppression costs for 1985–2018 scaled to constant (2016) U.S. dollars. Trends for both wildfire area burned and suppression indicate about a four-fold increase over a 30-year period. Data source: National Interagency Fire Center, Fire Information Statistics, accessed December 2, 2019. https://www.nifc.gov/fireInfo/fireInfo_statistics.html.

In this review, Dr. Jaffe and his coauthors describe the current state of the research and identify key data gaps. Their goal is to identify areas that are well understood and areas that need more research. They recommend eight specific areas for future research.

Read the paper here

Free paper eprints available here

Dan Jaffe selected as subject matter expert for EPA pool reviewing PM and O3 standards

The US Environmental Protection Agency (EPA) has selected Dan Jaffe as one of 12 subject matter experts supporting the Chartered Clean Air Scientific Advisory Committee (CASC) in its review of the National Ambient Air Quality Standards (NAAQS) for particulate matter (PM) and ozone (O3).  The pool of experts will provide technical expertise to the CASC as it reviews the US EPA’s NAAQS. The CASC will in turn provide the EPA administrator with independent advice on the technical basis for the NAAQS.

“This appointment represents an opportunity to use my scientific expertise to support the EPA’s decision-making,” Jaffe said. “The long-term goal should be that our environmental laws, rules and regulations be based on the best available science and be designed to protect public health with an adequate margin of safety.”

Read the news release by the EPA

Read a news release by UW Bothell

Communal support for residents suffering from smoky air

Public officials in several western regions and communities are identifying ways to shield residents from smoke-filled air and to offer communal support when  residents are faced with poor air quality and the impact of climate change. A recent article in the Christian Science Monitor looks at initiatives such as the city of Seattle’s program in which five public buildings were set up as clean-air centers where residents can take shelter if summer wildfire smoke impacts air quality. Dan Jaffe, along with Alex Margarito (UW Bothell graduate) and Rebecca Rickett (UW Bothell student), are working with the city to analyze the effectiveness of these clean-air centers.

In other action, two US senators are introducing “legislation that would provide federal funding to communities to improve ventilation systems in public buildings and set up emergency smoke shelters.” A California state assemblywoman also proposed a state program to improve “ventilation systems in schools, libraries, and community and senior centers” so that residents have a safe haven when air quality is poor.

The particulate matter in smoky air is a health hazard that affects everyone but hits the most vulnerable, including children and the elderly, the hardest. In addition to the physical toll, residents facing wildfire smoke may experience negative mental health effects. Researchers at the University of Montana in Missoula Human Dimensions Lab  found that bringing residents together can help alleviate anxiety. As Libby Metcalf, lab co-director, says, “There’s a need to have a community gathering space to share stories about wildfire…It’s a way for people to feel like they don’t have to face what’s happening on their own.” The American Psychological Association also identifies communal support as an essential remedy to the depression and desolation that people may experience as they cope with the impact of climate change. Officials such as Julia Reed, senior policy adviser to the Seattle mayor, also see the need to bring people together: “All of us see climate change happening right outside our window,” she says. “Coming together is a way to make people feel less helpless.”

Read the full article here.

Wildfire smoke impacts indoor air quality

The last two years in Seattle were the worst on record for wildfire smoke and its impact on air quality. Smoke-filled air contains fine particles of 2.5 microns in diameter or smaller (PM2.5), which pose a significant health risk because they can move deeply into the lungs. When the air quality outside is “unhealthy for all” according to the EPA because the PM2.5 level is above 55 μg/m3, residents are told to remain inside as much as possible. This occurred 2 days in 2017 and 4 days in 2018. The very young, elderly, and sensitive individuals are particularly at risk to air quality with PM2.5 above 35 μg/m3. However, is the air inside that much better? Even with the windows and doors closed, is the air inside at a healthy level during a smoke event?

Worst ever smoke in Seattle on Aug. 21, 2018
Seattle experiences the worst smoke ever (PM2.5 of 110 μg/m3) on August 21, 2018. Photo courtesy of Dan Jaffe.

Last August during a smoke event in the region, Dan Jaffe was curious about the air quality in his office at UW Bothell and elsewhere on campus. He and Alex Margarito, a recent UW Bothell grad who was then a student in Jaffe’s research group, took measurements in Jaffe’s and other offices on campus, in classrooms, and in Jaffe’s Seattle home. They discovered that the inside air was often bad. On August 22, Jaffe measured PM2.5 of 100 μg/m3 inside his office in Discovery Hall at UW Bothell. “You couldn’t tell that it was that bad inside until you actually took the measurements,” Margarito said. “What we found is that the air inside buildings eventually can get near the same levels as what’s outside. So sitting inside is not going to do that well for you.”

This summer Alex Margarito and Rebecca Rickett, a UW Bothell Biochemistry major, are working with Seattle Parks and Recreation to monitor and analyze indoor and outdoor air quality. This project is part of Seattle’s pilot program in which they installed enhanced filtering at five buildings in the city to offer residents an oasis if a smoke event hits the area. The city has also installed several low-cost sensors to measure air quality in several locations around the city.

Joelle Hammerstad, sustainable operations manager at Seattle Parks and Recreation, is excited that the city is partnering with Dan Jaffe and Margarito and Rickett on this project. “Bigger picture, we’re trying to understand the situation at our facilities when we have poor air quality,” Hammerstad said. “Are the measures effective?”

The city is also thinking about climate change. “This is a critical, pivotal moment where we’re refocusing how we’re thinking about climate change. We’re thinking about resilience, adaption,” Hammerstad said. “How do we help front-line communities get through this—communities that don’t have the resources to easily adapt to a changing climate?”

Read more on the UW Bothell website.

When Seattle experiences another smoky summer, the city is ready with 5 clean air centers

City officials in Seattle have invested in 5 facilities with free clean and cool air for residents if and when wildfires fill local skies with smoke this summer. A recent article in the Washington Post online describes Seattle’s new program. Seattle is retrofitting 5 facilities that had central cooling with advanced air filtration systems. These systems will be able to filter out microscopic particulates that are especially dangerous for children, elderly people, and those with heart or respiratory conditions. Indoor air sensors will also be installed in the city facilities to measure the air quality. Dan Jaffe, Alex Margarito-Lopez (recent UW Bothell graduate), and Rebecca Rickett (UW Bothell student) will be working with the city to interpret data from these sensors.

In the past two summers, Seattle experienced increased air pollution from wildfire smoke, including 4 days last summer that reached levels of fine particulate matter that were unhealthy for all individuals. Most homes in Seattle do not have air conditioning or air filtration systems. Many residents rely on opening the windows to cool their homes in the summer. When the outside air is polluted with smoke, opening windows leads to a house filled with polluted air. The new clean air centers will offer residents somewhere to go to get out of the polluted air.

Wildfires in the West have been increasing in recent years. A major factor in the worsening wildfire picture is human-driven climate change, which is causing drier and warmer conditions. Seattle Mayor Jenny Durkan recognized that local governments need to step up “to be ready for the climate changes we’re experiencing in Seattle.” These centers are part of an effort to address climate change’s impacts.

The wildfire outlook is “strong wildfires, much larger than normal,”  Dan Jaffe says. “It’s going to get worse. How much worse we don’t know, but we need to adapt. Whether that’s thinking about clean air, cool spaces to go to during the daytime, or whether that means shoring up beaches, or whatever it means, communities across the country need to adapt to climate change.”

Read the full Washington Post Energy 202 article.

Wildfires are causing extreme PM in the western US

Wildfire smoke on 9/6/2017
Wildfire smoke covering the Pacific Northwest and British Columbia on September 6, 2017, from MODIS true color reflectance image. Red dots represent fire locations. Source: https://worldview.earthdata.nasa.gov.

New research by James Laing and Dan Jaffe shows how increases in wildfire smoke have impacted air quality in the western US. Their recent paper, published in the June 2019 issue of EM—The Magazine for Environmental Managers, describes the changing air quality picture for western states. Even though air quality in most of the US has improved in the last four decades, due in large part to the US Clean Air Act regulations, it is not improving in much of the western US. The reason for the decrease in air quality in western states is wildfire smoke.

In 2017 and 2018, wildfires caused the largest daily mean concentrations of fine particulate matter (PM2.5; particles with diameter less than 2.5 μm) ever measured at monitoring sites in the US. Some of the extreme PM2.5 events of 2017–2018 include the following:

  • Seeley Lake, Montana, September 6, 2017—Highest daily PM2.5 on record (642 μg/m3). In August-September 2017, there were 35 days with PM2.5 > 150 μg/m3 and 18 with PM2.5 > 250 μg/m3.
  • Ventura, California, December 6, 2017—PM2.5 of 557 μg/m3, with a two-week average concentration of 165 μg/m3.
  • Seattle, Washington, August 21, 2018—Highest daily PM2.5 ever recorded in Seattle (110 μg/m3).
  • Medford, Oregon, September 6, 2017—Highest daily PM2.5 ever recorded in Medford (268 μg/m3), and eight days over 100 μg/m3 in 2017.

To put these measurements in context, the US Environmental Protection Agency (EPA) has set the daily PM2.5 standard at 35 μg/m3 (98th percentile < 35 μg/m3, averaged over 3 years). The EPA has also defined PM2.5 > 150 μg/m3 as very unhealthy and PM2.5 > 250 μg/m3 as hazardous. PM2.5 is such a health hazard because it can travel deep into the respiratory system due to its small size. Despite the gains in air quality in the US, about 30 million people live where the PM2.5 standard is not being met.

The estimated increase in the number and size of wildfires in the future raises issues for public officials and environmental managers. Complying with air quality standards and reducing human exposure to PM2.5 are causes for concern in the western US now and going forward.

Read the full paper here

Do wildfires contribute to ozone events in an urban area?

Do wildfires contribute to ozone pr?
Wildfires emit primary pollutants, including particulate matter (PM), carbon monoxide (CO), nitrogen oxides (NOx [=NO+NO2]), and volatile organic compounds (VOCs) and contribute to the formation of secondary pollutants, such as ozone (O3) and peroxyacetyl nitrate (PAN). Wildfire emissions can enhance the production of O3 through the addition of NOx and VOCs. This paper investigated how wildfire emissions influenced the formation of ozone in an urban area.


In a recent Atmospheric Environment paper, Crystal McClure and Dan Jaffe investigated ozone (O3) enhancements during wildfire events in the Boise, Idaho, urban area over 2006–2017 and during a 2017 summer intensive campaign. They determined whether wildfire emissions are influencing the area by calculating a wildfire criterion based on NOAA’s Hazard Mapping System (HMS) smoke product and historically averaged fine particulate matter (diameter < 2.5 μm [PM2.5]) data. Using this criterion, they could categorize smoke vs. non-smoke events. They also used a Generalized Additive Model (GAM) to look at unusual sources of O3, such as wildfires. GAMs are useful in analyzing sources of O3 production by looking at meteorological and transport variables.

During the 2017 summer intensive campaign, they found that peroxyacetyl nitrate (PAN), reactive nitrogen (NOy), and maximum daily 8 hour average (MDA8) O3 showed significant enhancements during smoke events. These findings show that wildfire-influenced O3 enhancements are highly variable in urban areas—O3 enhancements generally increase up to around 60 μg/m3 of PM2.5 and then decrease at very high smoke concentrations.

This research suggests that measurements of multiple tracers are essential in order to fully describe wildfire plumes in urban areas. McClure and Jaffe conclude, “While we identify some effects on O3 due to wildfire emissions in an urban area, the need for improved classification of smoke versus non-smoke influenced days will likely become more important throughout the western U.S. as wildfire frequency and intensity are predicted to increase through the end of the century.”

Read the paper here

Wildfires and poor air quality—Is this the new normal?

When smoke gets in your eyes this summer, your thoughts are probably turning to wildfires. Wildfires are on nearly everyone’s mind these days in the Pacific Northwest because of the smoky haze and poor air quality that is blanketing our area. This August is similar to August 2017, and so you might wonder—why is this happening and is it going to continue? Those are the questions many reporters have been asking Dan Jaffe in the last few weeks.

A new paper by group members Crystal McClure and Dan Jaffe published in the Proceedings of the National Academy of Science addresses these questions. This research highlights the dramatic gains in air quality that have taken place in the last few decades around the country except in the Northwest. In this region, the 98th percentile of daily fine particulate matter (PM2.5), or in other words the seven worst air quality days each year, is getting worse. Around the US, there have been improvements in air quality from reduced power plant, industry, and automobile emissions, but in the Northwest, those reductions are outweighed by the emissions from wildfires. Learn more about this paper.

The indications are that the wildfire season will continue to get worse in the Northwest. Forest management practices and meteorological factors such as increased spring and summer temperatures, earlier snowmelt, and dryer forest conditions contribute to the current situation. “We want to be careful not to put it all on climate change, but climate change is clearly a contributing factor, and particularly in the size of these fires,” Dan Jaffe told E&E News. “A fire that used to become a small fire has now become a massive conflagration.” We will see more high fire years and, in general, longer fire seasons and bigger fires.

The increase in wildfires and smoky conditions causes adverse health effects. Wildfires are a major source of fine particulate matter, which is small enough to be inhaled deeply into the lungs. The health impacts of breathing smoke can be significant, especially for children, the elderly, and people with pulmonary, cardiovascular, and other chronic conditions.

To listen and watch interviews with Dan Jaffe about wildfires and air quality, visit:

To read more, see:

To see all news reports and articles about our research, see our In the News page.

Background ozone and implications for air quality management

In a new paper published in Elementa, Dan Jaffe and his coauthors look at background ozone in the US and how it influences whether states can meet air quality standards. Background ozone (O3) includes “contributions from natural and foreign sources of O3 that cannot be controlled by precursor emissions reductions solely within the US.” Understanding background O3 is necessary for air quality management overall and for states and municipalities to meet national air quality standards.

They examined over 100 published studies in order to assess what is the current knowledge about the distribution, trends, and sources of background ozone in the continental US. They found that “noncontrollable O3 sources, such as stratospheric intrusions or precursors from wildfires, can make significant contributions to O3 on some days, but it is challenging to quantify accurately these contributions.” In order to address this shortcoming, they recommend a more coordinated and focused approach to understanding background ozone in the US: improvements in the monitoring network, large-scale field experiments, more accurate and consistent chemical transport models, and more detailed observations of wildfires.

Read the paper here

US particulate matter air quality improves except in wildfire-prone areas—See our new group paper!

A new paper authored by Crystal McClure and Dan Jaffe describes the increasing  particulate matter (PM2.5) pollution over the last few decades in the Northwest. This research, published Monday in Proceedings of the National Academy of Sciences, analyzed PM2.5 data from rural monitoring (IMPROVE) sites across the contiguous US for 1988–2016. They found a decreasing trend  in PM2.5, and cleaner air, around the country except for in the Northwest, where there is a positive trend in PM2.5. This positive trend is associated with total carbon, a marker for wildfires.

The figure below shows trends in PM2.5 for 1988–2016 for the 98th quantile, that is, the seven highest days. In most of the Northwest (red and orange areas), these days are getting worse, while most of the country has improving air quality trends (purple, blue, and green areas).

Figure 1 in PNAS paper US particulate matter air quality improves except in wildfire-prone areas
The 98th Quantile Regression of PM2.5 trends. Observed PM trends for 1988–2016 (calculated using QR methods) from IMPROVE sites are shown by black dots with corresponding values in µg·m−3·y−1. Krige-interpolated values (calculated from observed data) are shown by the color ramp. Solid black lines with arrows (indicating direction) show the boundary where the Krige-interpolated PM2.5 trends within have a 90% probability of being positive or negative. Of the 157 sites, 92 show statistical significance (8 positive/84 negative).

Read the abstract on the PNAS website

This new research has been garnering a lot of press since its publication: