Summary
We conducted the Panel Study of MAGA Supporters (PSMS) between 12/24 and 12/31, 2020. Because we were interested in the views of a specialized population (MAGA movement members), we recruited participants using Facebook ads that targeted users who listed “Make America Great Again” (MAGA) as an interest. Facebook Ads’ MAGA interest description states that it includes “people who have expressed an interest in or liked pages related to Make America Great Again.” Overall, there are 6,610,370 Facebook users categorized in the MAGA pool (that is, possible targets for this ad). A test batch of ads was run between 12/23 and 12/26. The full batch of ads ran between 12/26 and 12/31 and were shown to users in all 50 states, proportional to state population. Due to low response rates among females, we increased the number of ads targeting female respondents between 12/29 and 12/31.
Facebook provided us with the following metrics for evaluating ad reach. The ad was served 217,365 times (also known as impressions) in the newsfeeds of MAGA Facebook users. 106,209 users saw the ad in total (the reach). Some people saw the ad more than once, hence the difference between the impressions and the reach. 4,394 unique users clicked on ad, which led them to the survey. Of these, 3,269 started the survey. 1,981 people completed the survey in its entirety, resulting in a click-to-completion rate (our best approximation of a response rate) of 45%.
The majority of responses occurred on 12/26 and 12/27. The majority of respondents took between 29 and 38 minutes to finish the survey.
Survey participants
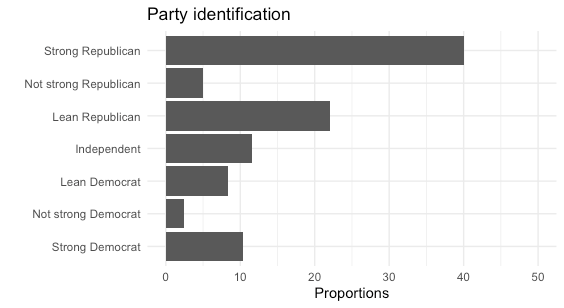
The MAGA interest on Facebook includes any user who interacts consistently with or likes MAGA-related pages. While we might surmise that the majority of these users have an authentic interest in MAGA, we cannot rule out the possibility that some users might be following MAGA as a sort of casual opposition research. In anticipation of this, we included several metrics on the survey to distinguish “real” MAGA followers from opposition researchers. These included questions about party identification, group membership, and voting patterns.
In total, 21% of the sample identified as Democrats or independents who leaned Democrats, 12% as Independents, and 67% as Republicans or independents who leaned Republican. The self-identified Democrats were dropped from our final analysis, as they demonstrated throughout the survey that they did not have an authentic interest in MAGA. We subset the sample to exclude any self-identified Democrats or lean-Democrats, and any independents who reported voting for Democrats in every election between 2016 and 2020. The remaining respondents included self-identified Republicans, lean-Republicans, and independents who voted Republican in at least one election between 2016 and 2020. The final sample was made up of 1,431 participants.
In addition to “forced-choice” responses, we also included several “open-ended” responses as a means of encouraging respondents to elaborate their answers on selected questions. Responses were prepared for processing using standard techniques. These included standardization of the spelling of common words (e.g., correcting “electorial” to “electoral”), removal of punctuation, stripping of white space, and removal of common English stop words (e.g., the, and). Documents were then transformed into a document-feature matrix using the package Quanteda in R. Topic modeling was implemented using the LDA package in R. We settled on two as the number of topics after examining the output at k=2,4,6,8, and 10 topics. Two presented the clearest difference between topics while minimizing overlap.
Second wave
Upon completion of the survey, respondents were given the option to leave their email address if they wished to receive updates on the survey. In total, 742 respondents left authentic email addresses. On 1/13/21 we fielded a follow-up wave to these participants. We concluded data collection on Wave 2 on 1/29. In total, 319 of those we re-contacted started the survey. Of this number, we retained 295 respondents. The balance of the cases were screened out for various reasons, e.g., incomplete, etc. Median time to survey completion was 22 minutes.