November 15, 2017
Minimum time for an electric Cannonball Run

Rochelle Starrett

Cole Kopca
The advent of the automobile brought an unprecedented level of freedom for Americans: the promise of going anywhere at anytime. To push this ideal to the limits, people have taken this freedom even farther, driving across the country as fast as possible. This exercise is eloquently named the Cannonball Run after Edwin “Cannonball” Baker who set the initial record in 1933 in a crazy (for its time) 53 hours and 30 minutes. The current record for the drive from the Red Ball Garage in Manhattan to the Portofino Hotel in Redondo Beach, California, stands at 28 hours and 50 minutes for a regular car (average speed of 98 mph). To continue pushing the limits like the original “Cannonball,” drivers are now attempting to set the record in Tesla electric vehicles (currently at 55 hours). (Ed: Since reduced to 51:47 as of July 2017) Breaking this record is complicated by the longer charging times required for electric vehicles (EVs) compared to the refueling time for conventional automobiles and the relative scarcity of EV charging infrastructure compared to gas stations.
To overcome these barriers, an optimal charging and driving strategy can be assessed using an optimization framework based on the existing network of Tesla superchargers, the relationship between speed and range for EVs, and the relationship between charge time and range for EVs. This frameworks was applied specifically to estimate the theoretical minimum time to drive an unmodified Tesla Model S 90D from the Portofino Hotel to the Red Ball Garage.
Model Framework
The total time to drive an EV across the country can be approximated by the total drive time and the total recharge time, as seen below:
Total Time = Time to Drive + Time to Charge
The major constraint on the above problem is that the available range after leaving a charging station must be greater than the distance to the next charging station. Equivalently, this can be formulated as the available battery energy must be greater than the energy required to get to the next charging point. Another (less restrictive constraint) is that a minimum speed of 40 mph must be maintained to legally drive on the interstate highway system. Adding this constraint ensures that a viable strategy is not to drive slowly, effectively extending the EV range and reducing overall charging time required. While this was included as a constraint, it is most likely unnecessary due to the magnitude of the overall drive time compared to the charge time given the distances driven.
After formulating the optimization problem and constraints, the appropriate data could be collected to solve the problem given its constraints.
Feasible Routes
To determine an initial set of feasible routes between these locations, Google maps was used to identify routes between The Red Ball Garage and the Portofino Hotel, seen below in Figure 1.

Figure 1: Suggested Routes for the Cannonball Run
Google Maps suggests two routes across the US, both using the Federal Interstate system. The upper route follows I-80 while the lower route follows I-40, among other interstates. While it is possible that there are other, shorter routes, between these two locations, driving on the interstate would likely be the fastest route due to higher speeds and limited access compared to local roads. Particularly important for EVs, interstates are more likely to have electric charging facilities nearby, ensuring that the route can be followed directly. Therefore, only these two routes were considered.
Tesla Supercharger Locations
After the feasible route set was identified, Tesla supercharger locations along these routes were identified, along with the distance between each charging location. Figure 2, below, shows the locations of all the Tesla supercharger locations in the US, both existing and planned. For this study, only the existing supercharger locations were considered. Furthermore, supercharger locations were only included for analysis if they were located immediately adjacent to the interstate facility as opposed to a nearby interstate spur that would not be directly accessible without a detour from the best route. As seen below, most of the US is covered by supercharging locations at this point, particularly along interstate highways, facilitating inter-city travel like this.

Figure 2: Tesla Supercharger Locations
Vehicle Performance
As vehicle speed increases, the overall work required to move the vehicle also increases due to increased drag and other resistance on the vehicle, increasing the overall power required for the vehicle. This problem was considered from both a vehicle range and an energy perspective. As seen below in Figure 3, vehicle range is highest for speeds between 20 and 25 mph before dropping as speed increases. Since we are only considering speeds above 40 mph, this can be approximated as a linear function, seen below.
Range = 575 – 4.7*speed, speed > 40 mph
This equation was used to provide an initial estimate of the Model S range given that a constant speed was driven across the country.

Figure 3: Range vs. Speed for Tesla Model S
To consider this problem from an energy perspective, the power consumption per mile as a function of vehicle speed, seen below in Figure 4, is important to know.
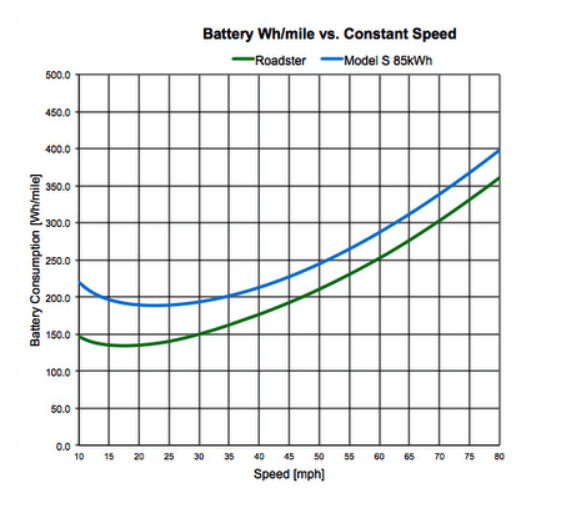
Figure 4: Battery Consumption vs. Speed for Tesla Model S
As expected, these graphs are inversely related. As speed increases, battery consumption per mile also increases, decreasing the overall range of the EV. Power to overcome aerodynamic drag is proportional to the cube of the vehicle speed. Therefore, battery consumption, measured on a watt-hour per mile basis, is proportional to just the square of the speed. Using the above figure, the following equation relating battery consumption and speed is identified:
Battery consumption = 0.066*V2-3.10*V+232.74
Supercharger Performance
When a vehicle is charging, most of the power transfer occurs during the first portion of the charge. As the battery is increasingly charged, the energy transfer rate decreases to avoid damaging the battery. Tesla provides expected range performance for a given charge time on their website, seen below in Figure 5 for the Tesla Model S 90D.
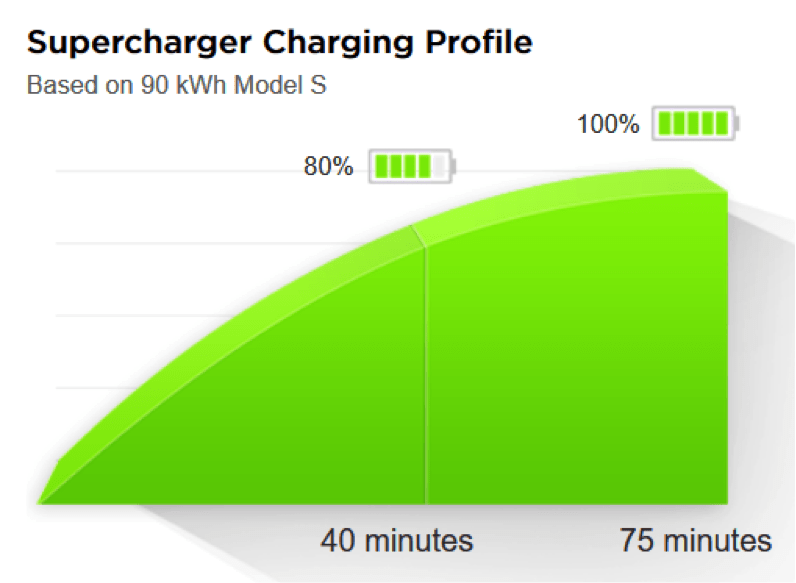
Figure 5: Tesla Supercharger Performance Profile
These provided estimates are rather limited, however, due to relatively few data points shown on them. Thankfully, other Tesla users and enthusiasts have provided information on their own experience charing their Tesla using superchargers. These sources were combined to generate a supercharging profile for the Tesla Model S 85D, seen below in Figure 6.
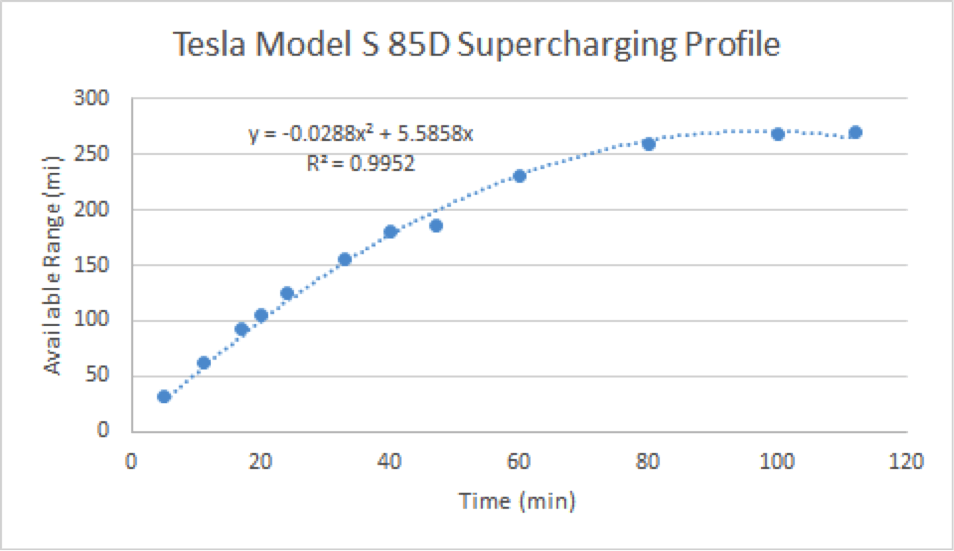
Figure 6: Tesla Supercharger Profile
Although it is for a different vehicle, it was assumed that this curve could be standardized to different vehicle types, regardless of overall vehicle range. This curve was standardized using the 270 mile range of the Tesla Model S 85D. This can then be scaled to the 294 mile range or the 90 kWh of the Tesla Model S 90D. Furthermore, it was also assumed that a given vehicle range was directly related to the overall power in the battery after a given charge time. These assumptions give the following equations for range of battery power as a function of charging time.
Range = (-0.029*t2+5.59*t)*294/270
Battery Consumption = (-0.029*t2+5.59*t)*90/270
Range/Battery Constraints
Using the above equations, constraints for either the range or battery can be formulated for the distance between each station. As the Tesla arrives at a charging station, the available range or battery is a function of the range or battery from the previous charging station (a combination of the available energy when the Tesla arrived at that station and the time spent charging at that station) and the energy used while driving to the next station. These expressions can be formulated mathematically, as seen below, for the Tesla’s arrival into charging station i.
Rangei = Rangei-1+ Range(Time Chargingi-1) – Distancei-1 to i
Batteryi = Batteryi-1 + Battery(Time Chargingi-1) – Battery Consumption(Speedi-1 to i)*Distancei-1 to i
Analyzing these equations, the limitation of using range as a constraint as opposed to available battery becomes immediately apparent. The equation for range as a function of travel speed can only be applied to determine the initial vehicle range and as such, each additional time the battery is charged can be directly related to the distance travelled. This approach does not account for the inherent inefficiencies at high operating speeds as readily as the battery approach does.
Recommended Route & Charging Strategy
Based on the above problem specification, solving the Cannonball run for a Tesla can be formulated into three separate optimization problems to determine the optimal route and charging strategy, all with the problem specification described above. In the first case, the problem constraints are based on the vehicle range being sufficient to reach the next charging station. This method assumes constant speed throughout the trip. As mentioned previously, this approach is limited since the maximum range is the only time speed is considered in the optimization problem, so the inefficiencies at high speed is not accounted for outside of the initial range estimation. This will likely underestimate the theoretical minimum travel time. The other two approaches formulate the problem to ensure that the available battery power is sufficient to reach the next charging station. This overcomes the limitation of the previous approach because there are measures of battery consumption per mile available for this vehicle. This can then be formulated into two approaches by considering a constant speed for the duration of the trip or allowing the speed to vary on individual segments between charging stations.
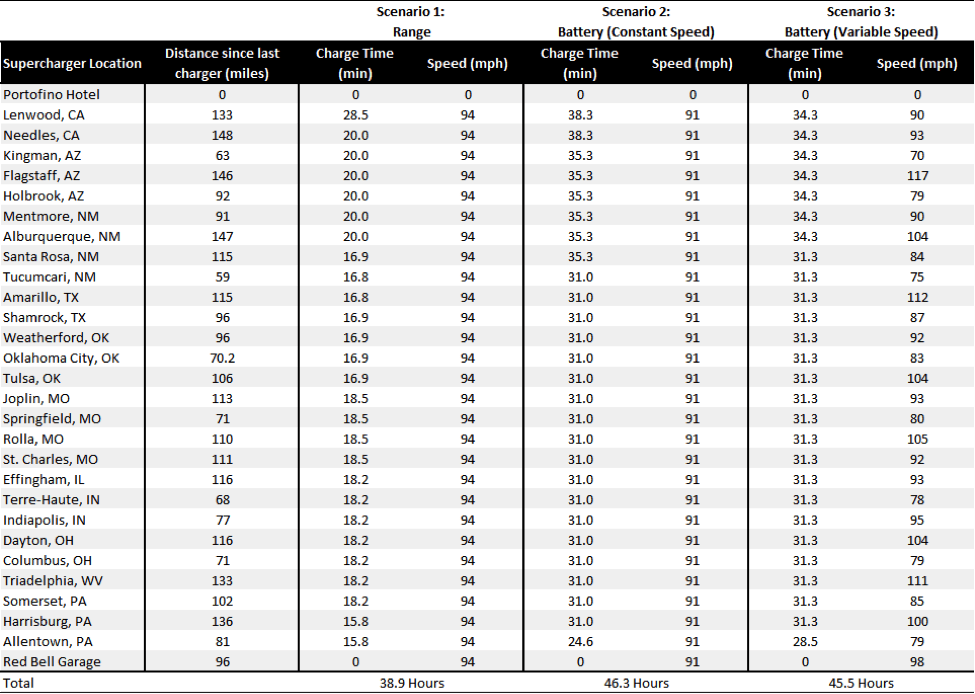
After completing the problem formulation, the results were coded in excel solver and analyzed. For all scenarios, taking the I-40 route yielded a smaller driving time. The results of these three approaches and the recommended charging strategy and speed are summarized below in Table 1.
Among the two scenarios that incorporate battery power in the optimization, the variable speed scenario in not only more realistic, but also provides a faster time (45.5 hours as opposed to 46.3 hours for the constant speed scenario). While the lay reader may take issue with the fact that all of the suggested speeds fall well above any interstate posted speed limits anywhere in the United States (as high as 117 mph from Kingman, AZ to Flagstaff, AZ), it is important to note that legal infraction is the name of the game in the Cannonball Run (average speed for every record holder have been higher than posted interstate speed limits, with at least one participant admitting to reaching speeds of over 200 mph at several points during their journey).
Table 1: Recommended Charging Strategy and Speeds for Analysis Scenarios
Additional Energy Use
As we have stated previously, energy use (or battery consumption) is a function of the speed at which the vehicle operates and the distance travelled. Thus the energy consumed at the speeds that are recommended in optimization Scenario 3, which all exceed interstate speed limits, will similarly exceed those consumed by a vehicle that makes the same trip at the posted speed limit. So if it were assumed that the interstate speed limit were 70 mph, using the battery-consumption-as-a-function-of-speed equation given above, the total energy consumed for the 2,800 mile journey would be roughly 950 kWh. Using the same equation but the varying speeds and distances as outlined above in Scenario 3, the total energy consumed for the journey would require roughly 1,537 kWh. This would be a total additional energy consumption of 587 kWh or 62% more energy.
Limitations
Obvious to some, this exercise made several unrealistic assumptions in order to execute the optimization as outlined thus far. These weak points will be further explored below (they are listed in order of priority and magnitude of effect):
The most unrealistic of the assumptions was certainly the fact that congestion of any kind was totally ignored. A journey that takes 45.5 hours will require the participant to drive through at least one revolution of daylight hours. The I-40 route requires the participant to travel through a number of larger metropolitan areas including Columbus, OH, Indianapolis, IN, St. Louis, MO, Tulsa, OK, Oklahoma City, OK, and Albuquerque, NM, not to mention getting in/out of Manhattan and Los Angeles. Each of these cities will likely have some amount of congestion slow down. This is not to mention that our model ignores accidents, construction zones, and tolls, or any other situations that would prevent the participant from traveling at the constant speed suggested. To make this exercise more realistic and robust, some kind of adjustment factor would need to be taken into account for these inevitable slow downs. Furthermore, the equations used to optimize this problem were based on an assumption of constant speed between charging stations. If speed is not constant, there will likely be additional power required for accelerating or decelerating not accounted for here which would further increase the charging time.
In this exercise, the values generated in Scenario 3 suggest that the vehicle would take in just enough energy while charging so as to get the vehicle to the next charging station. In reality, the runner would likely want to keep some small amount of reserve energy so as never to run completely out of energy. Our model further didn’t consider the small amount of driving it would take to get the vehicle from the highway to the actual charging station. As stated previously, the only charging stations considered were those that are directly adjacent to the highway, however, because those charging stations are not actually located on the side of the highway, the user will need to exit the highway and drive some nominal distance to the charging station. This would also require slightly more energy. The necessity to keep some energy reserves would likely slightly increase the charging times, since charging time increases as a function of the amount of power available in the battery.
Another important factor that was disregarded has to do with the charging stations. It was inherently assumed that each charging station would be available during the charging time needed, and that there would be no other Tesla users charging their vehicles and slowing down the charge time. Several Tesla users would suggest that these assumptions should not necessarily be waved away so easily. If the Cannonball runner reaches a charging station that is fully occupied, or one where at least several of the chargers are occupied there could be, at minimum, a slow down in the rate of charging, and at maximum, the participant would need to wait for a spot to charge. This model further does not take into account any amount of time it takes to initiate the charging itself. So for example, if it take two minutes to get the charging started, this may provide some additional competitive advantage to the tactic of pulling enough charge to skip the next charging station and make it all the way to the following station.
Furthermore, the supercharging profile Figure 6 generated above, shows data for a Tesla S 85D while the current EV record was set by a Tesla S 90D, and this exercise was investigating the use of a Tesla S 90D. This data was still used because no similar detailed information could be found for the S 90D. In theory, the supercharging profile of the S 90D may rise more steeply than the one generated for the S 85D above, which would reduce charge times. Conversely, the battery for the S 90D may be heavier than the battery for the S 85D which would make the overall weight of the vehicle heavier, increasing the rolling friction. This may increase the energy consumed to move the vehicle. This is particularly relevant since the estimates of battery consumption vs. speed were only available for the S 85D.
Finally, this analysis was completed using only the currently available charging stations, although as seen in Figure 2, above, Tesla has further plans to expand their supercharging network to include more locations. As more locations open, this theoretical minimum time is only likely to further decrease.
Conclusion
This exercise described above builds an optimization problem for identifying the minimum overall time it would take a Tesla S 90D to drive from the Red Ball Garage in Manhattan (New York City) to the the Portofino Hotel in Redondo Beach, California. It does this by taking into account both drive time and charging time. Drive time is a function of speed and limited by how quickly the energy is consumed at different operating speeds. Charging time is a function of how full the battery is. This situation is further constrained by the scarce, and static locations of Tesla supercharging stations. Three different scenarios were considered: one that only utilizes the problem constraints based on the vehicle range, the second that incorporates the change in efficiency as a function of speed, but keeps the speed constant over the course of the journey, and the third that is like the second but allows for the speed to vary across legs of the trip.
Ultimately, we find the third scenario to be the most realistic and optimistic model, with the caveat of the limitations discussion from the section above. The optimal charging time and speeds is outlined above in Table 1. The total theoretical minimum time for the Tesla Cannonball run is 45.4 hours given the current charging infrastructure.
One obvious, practical question in this exercise is whether it makes more sense to spend the marginal time at one charging station that would allow the runner to skip the next charging station and make it to the station that is two down the chain. Interestingly, based on the results in Scenario 3, this is not the case even once. In every leg, it makes most sense to charge the battery just enough for the vehicle to get to the next charging station.
It is difficult to say how much more time would be added to our calculated value if all of the limitations were addressed. Regardless it is clear that the current record is quite impressive.
Recent Comments