| FHL Weather Data
Weather Station |
|||||||||||||||||||||||||||||||||||||||||||||||
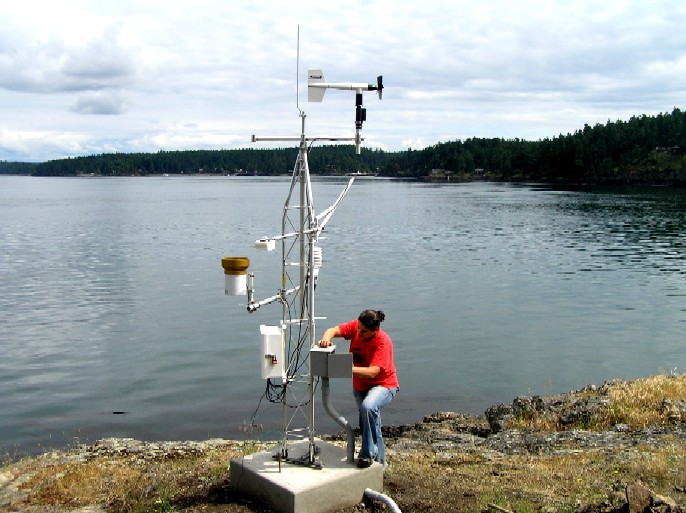
| In June 2006, the Carrington lab installed a Campbell Scientific Weather Station at Cantilever Point on the FHL campus. We added underwater sensors (-1.7 m below MLLW) from 2010-2016. Temperature loggers have also been deployed along a vertical transect (20ft to 80ft) by the Sebens lab since 2006. Each parameter monitored by the weather station is listed below with the corresponding unit of measurement and instrument. | |||||||||||||||||||||||||||||||||||||||||||||||
|
|||||||||||||||||||||||||||||||||||||||||||||||
| Click here to go directly to the weather station data. This link will take you to the Vista Data Vision data browser. From here choose a site and page (see below for list). Note that verified data have been checked for errors.
Active Instruments (real-time data stream) FHL Main Tower (archived at bco-dmo.org here) Air temperature, Wind, Relative Humidity, Rainfall, Solar Radiation (PAR, Energy, Total)
Inactive Instruments Underwater (Feb 2010- Sept 2016, archived at bco-dmo.org here) Temperature, salinity, and conductivity
Pumphouse A (unverified only) Temperature Models: Snails
Pumphouse B (unverified only) Temperature Models: Barnacle
Shady Cove Pumphouse Temp along depth transect (20-80 ft) White Sign
|
|||||||||||||||||||||||||||||||||||||||||||||||