November 4, 2016
Construction emissions from Sound Transit 3

Don MacKenzie
I was contacted by a reporter earlier this week about fact-checking some numbers relating to the new light rail construction in Sound Transit 3. In particular, would the carbon emissions savings from shifting car travel to light rail be enough to offset the emissions associated with constructing the light rail system? Especially when we consider the energy that goes into tunneling?
As I’ve been pretty busy this week with some other things, I was unable to respond in time. But since it was an interesting question I decided to look into it nonetheless.
First of all, it’s worth noting that there are myriad other sustainability issues linked to ST3, including access to opportunities, land use questions, and infrastructure footprint, to name but a few. I’m not addressing those here. Not because they’re unimportant, but because they’re not the question I was asked.
Second, we know that in general, light rail uses less energy and releases less emissions than car travel to move a passenger a given distance. This is the case whether we consider only operating emissions, or lifecycle emissions that also include infrastructure construction. The following figure from Chester & Horvath shows the lifecycle GHG emissions associated with light-duty vehicle travel and two different US light-rail systems (Boston’s Green Line and San Francisco’s Muni). (More details here.)
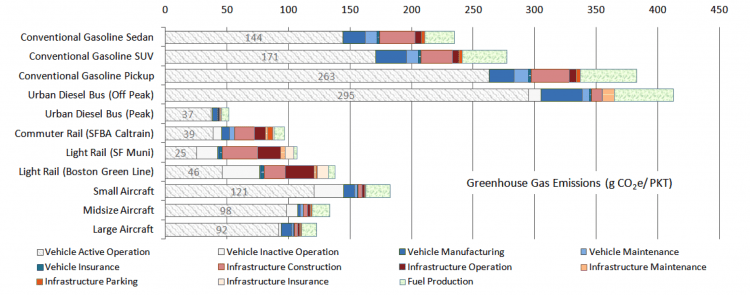
Of particular interest here is the finding that the infrastructure construction emissions are actually comparable or lower on a passenger-mile basis for light-rail than for automobile travel. The light-rail systems also reduce criteria pollutants, such as oxides of nitrogen (NOx, a key smog precursor), as shown at left. 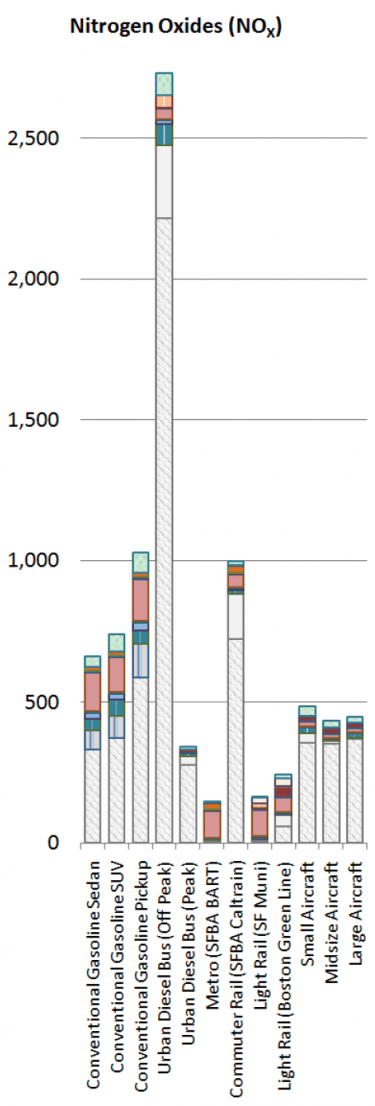
Nevertheless, I always like to check numbers for myself and see if they pencil out. My old boss, David Friedman, taught me to do these kind of “sanity checks.” The following should be regarded as extremely rough, but fairly conservative, especially since ST3 involves a significant amount of above-ground light rail.
First I considered the energy for tunnel boring and related systems. I couldn’t find specifications for the exact tunnel boring machines (TBMs) to be used on ST3, but a similar machine used on an LA Metro expansion has a total power of 3,400 kW. In a somewhat different hard-rock tunneling application, ancillary systems consumed about 80% as much power as the TBM. So, I conservatively assumed that overall power consumption would be 2X the TBM’s maximum power, or 7000 kW.
Assuming 50 feet of tunneling progress per day and 24 hour per day operation, it will take about 106 days of active tunneling per mile of tunnel. This translates to total electricity consumption of
105.6 days x 24 h/day x 7000 kW = 17.7 million kWh
Although our average electricity generation mix in the Northwest is very low-carbon, it is not clear that the marginal emissions (i.e. resulting from the additional electricity load generated by this specific project) will come from renewable sources. I therefore used the US EPA’s value of 0.7 kg CO2 / kWh for marginal electricity emissions, yielding an estimate of 12,400 tonnes of CO2 per mile of tunneling.
Next I considered the embodied energy in the concrete used to line the tunnel. Assuming a 21 foot outer diameter and a 10-inch thick wall, I get an inner radius of 9.67 feet and an outer radius of 10.5 feet. I then calculated the cross-sectional area of the concrete wall as
π(10.52 – 9.672)= 53 ft2
Therefore the volume of the concrete shell over a one mile length of tunnel would be
52.8 ft2 x 5280 ft = 279,000 ft3
Converting to cubic meters (7,900 m3) and multiplying by an emissions intensity of 400 kg CO2 / m3 translates to an additional 3.2 tonnes, for a total of 15.6 tonnes of CO2 per mile of tunnel.
Of course, we want to know how these up-front emissions are traded off against operational emissions reductions. I started by assuming a fairly conservative ridership of 50,000 per day and used Sound Transit’s estimate of 26,000 BTU/mile of electricity consumption per train car. The latter is rather low compared with national average numbers for rail transit (see Table 9.12) but those national averages include both light and heavy rail and, presumably, lots of older, less energy-efficient rolling stock. I also assumed twenty, 4-car trains per hour during peak hours (8h/day) and ten 2-car trains per hour during off-peak (12 h / day). (As a further sanity check, assuming a maximum capacity of 194 people per train car, this corresponds to a 30% overall load factor, i.e. trains averaging 30% of their maximum passenger capacity over the course of a day) Using the same US average emissions intensity for electricity, this translates to
(20 trains/h x 4 cars/train x 8 h/day + 10 trains/h x 2 cars/train x 12 h/day) x 26,000 BTU/car-mile = 23 million BTU / mile / day
This is equal to 6,700 kWh of electricity consumption per mile of system per day, which corresponds to 4.7 tonnes of emissions per day per mile of system.
If instead you moved those 50,000 people by cars with average occupancy of 1.6, that’s about 31,000 vehicle trips over the same mile. Assuming 25 mile per gallon fuel economy that’s 31,250 / 25 = 1250 gallons of fuel burned daily on each mile. Using EPA’s numbers for gasoline carbon intensity (8.8 kg CO2 / gallon) we get
1250 gallons x 8.8 kg CO2 / gallon = 11,000 kg = 11 tonnes of CO2 emissions per mile of system per day.
So, the daily operational emissions reduction under these assumptions is 6.3 tonnes per mile, meaning the construction emissions would be recouped after less than 7 years. Or, put another way, spread over a 50-year project life, the 15,400 tonnes of CO2 emissions correspond to emissions of about 850 kg/day/mile, or about one-seventh of the daily emissions savings from moving people from cars to light rail. And of course, this doesn’t even consider the emissions associated with building additional road capacity instead of light rail capacity.
In short: the construction emissions from tunneling appear to be a small fraction of the operational emissions reductions offered by ST3 under the assumptions used here.
Recent Comments