January 5, 2017
What p-values tell us and what they don’t

Don MacKenzie
Joe Janes from the UW’s Information School has an ongoing podcast series on “Documents that Changed the World.” His latest topic, Sir Ronald Fisher’s work establishing today’s standard threshold for statistical significance, definitely rises to that level. The podcast talks about the “surprisingly offhand manner” in which Fisher originally proposed a significance level of 0.05, something that my student, Yan, has previously referred to as “arbitrary magic.” It is an enjoyable story and worth 10 minutes, but unfortunately it misinterprets what a p-value means, and as a result it understates the risk of false positives in science.
The first problem in the podcast arises at the 5:50 mark, when Prof. Janes states that
Modern researchers would refer to this as a p-level of .05 – a 5% probability that a research result doesn’t indicate a real effect, but rather comes from some random source.
Quite simply, this is not what a p-value is. Last year, the American Statistical Association released a statement on p-values. It defines a p-value as:
Informally, a p-value is the probability under a specified statistical model that a statistical summary of the data (e.g., the sample mean difference between two compared groups) would be equal to or more extreme than its observed value.
The statement goes on to enunciate some principles about p-values, the first of which elaborates on the point above:
P-values can indicate how incompatible the data are with a specified statistical model.
A p-value provides one approach to summarizing the incompatibility between a particular set of data and a proposed model for the data. The most common context is a model, constructed under a set of assumptions, together with a so-called “null hypothesis.” Often the null hypothesis postulates the absence of an effect, such as no difference between two groups, or the absence of a relationship between a factor and an outcome. The smaller the p-value, the greater the statistical incompatibility of the data with the null hypothesis, if the underlying assumptions used to calculate the p-value hold. This incompatibility can be interpreted as casting doubt on or providing evidence against the null hypothesis or the underlying assumptions.
In other words (and even more informally), a small p-value means that there is a small probability that we would have seen data like what we saw, if the null hypothesis were true.
Lest there be any doubt, the ASA’s statement goes on to say:
P-values do not measure the probability that the studied hypothesis is true, or the probability that the data were produced by random chance alone.
Researchers often wish to turn a p-value into a statement about the truth of a null hypothesis, or about the probability that random chance produced the observed data. The p-value is neither. It is a statement about data in relation to a specified hypothetical explanation, and is not a statement about the explanation itself.
Prof. Janes notes that a logical implication of this is that 5% of published research results are untrue:
Also, consider this: if each statistically significant result has a 5% chance of being spurious, then it follows that 5% of all the statistically significant results out there, that have been published, aren’t real. They are due to random chance.
Unfortunately, this is also incorrect. To know the overall rate of false research results, we need to know the prevalance of true effects in the population, and our probability of detecting them when they are present. (The latter is measured with what we call statistical power.) Prof. Janes however points to a helpful example for understanding this:
Think of that 5% as the likelihood of a false positive on a test, or as one often hears in beginning stat classes, the likelihood of convicting an innocent person beyond a reasonable doubt.
Interestingly, in this case he gets the interpretation of a p-value more or less correct: the probability of that an innocent person will be convicted. (The incorrect interpretation above would is analogous to saying that the p-value represents the probability that a convict is actually innocent, which is different than the probability that an innocent person will be convicted).
So what a p-value (or really, a significance level α) of 0.05 is saying, is that 5% of those accused will still be convicted, even though they are innocent. Consider that an accused person (a null hypothesis) may be either innocent (true) or guilty (false), and either be convicted (rejected) or acquitted (failed to reject). Thus there are four outcomes: wrongful acquittal, correct conviction, wrongful conviction, and correct acquittal.
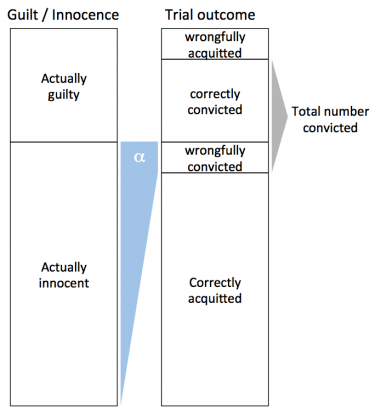
With α = 0.05 (equivalently, rejecting the null any time the p-value is less than 0.05), we are saying that
α = (number wrongfully convicted) / (number of innocent people tried) = 0.05
This will generally be different than the fraction of “significant results” that are actually spurious. That would be
(number wrongfully convicted) / (total number convicted)
In a system where lots of innocent people go on trial (lots of bogus theories are tested), the fraction of spurious results could be much more than 5%. In fact, in the extreme case where no one is actually guilty (all tested theories are untrue), we would still get “significant” results in 5% of cases, and 100% of those “significant results” would actually be incorrect.
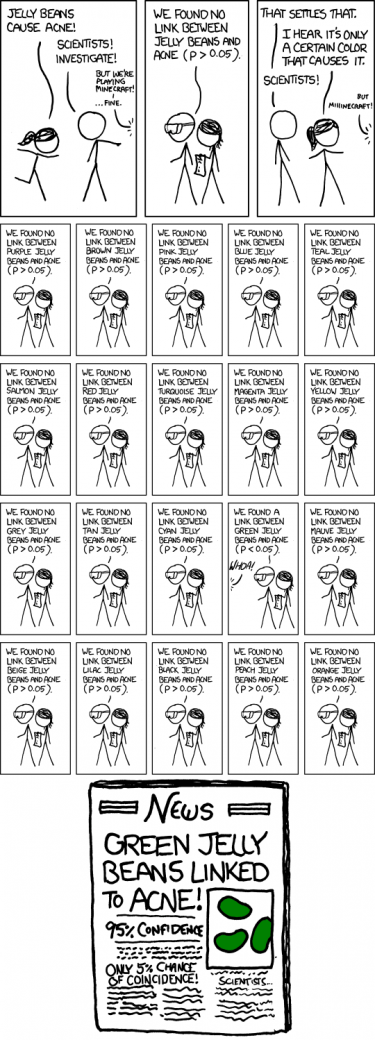
This problem gets even more pronounced when we introduce the problems of multiple comparisons and what Andrew Gelman calls the Garden of Forking Paths.
Recent Comments