June 7, 2017
The Chicken-Egg Problem of Transit and Density

Yanbo Ge
As two cities with similar regional importance in the Pacific Northwest, Seattle and Vancouver BC have a lot of similarities when it comes to climate and economic status. The two even hold pretty much the same city population (both a little more than 600,000 people). But Vancouver is much denser on average than Seattle (about 1.7 times), with limited urban area supporting a similar amount of urban activity as Seattle. Compact growth, including the basic elements of compact neighborhoods, transit-oriented development (TOD) and pedestrian- and bicycle-friendly design, has been promoted by urban planners for decades because it is considered a more sustainable form of urban growth than detached houses and strong automobile dependency. By this standard, it seems that Vancouver is on a better track.
A quick glance at the population distribution and the history of the transit of the two cities shows that Seattle brought in its rail transit service (Central Link) almost 25 years later than Vancouver’s Sky Train, and a big proportion of the neighborhoods with high density are close to the rail transit stations. It is unarguable that density can be influenced by multiple variables such as the economy, inter-regional and inter-municipal competition, but this difference in density between Seattle and Vancouver brought me into this question: does high-capacity high-speed transit bring in high density?
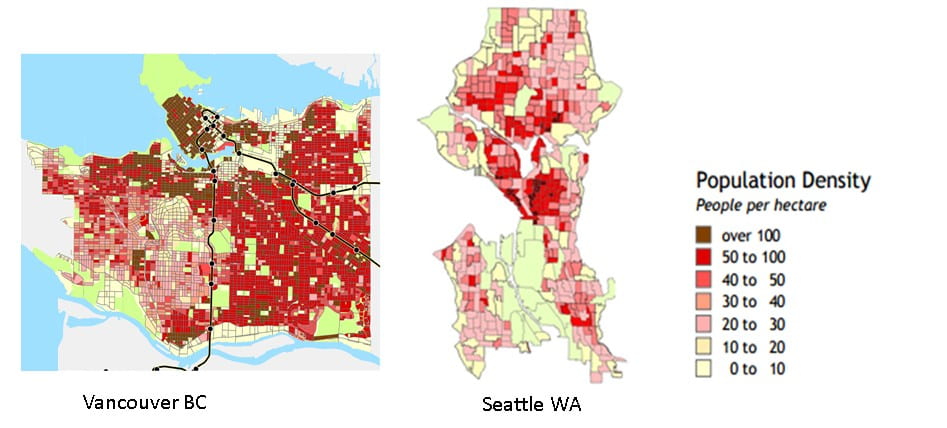
Figure 1. Density comparison between Vancouver BC and Seattle WA
To gain a little perspective on the relationship between urban density and rapid transit, I collected the population density data and the length of rail transit in 35 American cities[1], among which 13 cities have a rail transit system. The scatterplot below shows that the population density and the length of rail transit are correlated. Even though this is heavily influenced by cities like New York and San Francisco, this shows one straightforward conclusion: the most dense cities have rail transit, which suggests big cities may need high-capacity transit to support density growth. As a result, the population density of the cities is highly correlated with the transit mode share, as shown below.
![]()
Figure 2. Rapid transit system length, population density, and transit mode share
One question that is really hard to answer is what happens first: high-capacity/high-speed transit or high density? Some planners believe that the density has to be more than a certain threshold for the city to bring in high volume public transportation, while others, represented by TOD promoters, believe that in the urban planning process, mass transit needs to be put into place beforehand (where there is potential for density growth of course) to attract higher-density mixed-use developments, which then leads to higher density. To find out the causal relationship between transit and density, ideally, I would construct an experiment with a treatment group of cities that are assigned high-capacity transit systems at the same time and then compare the density growth with a control group after a certain period. To infer the causal relationship between transit and density, the treatment group and the control group have to be rather comparable when it comes to other conditions that can influence the density such as regional population attraction potential and economic status. Clearly, this is impossible to do. In reality, high capacity transit systems were built in the cities at different periods and other determinants of population growth are impossible to control.
I collected population density data for the year 1950 of the 35 American cities and plotted the population density increase since 1950 with the current network length of rail transit, as shown below. Generally speaking, a lot of American cities have seen density decline since the 1950s, even for cities with high-capacity transit such as Chicago, Washington DC, etc. For cities without high-speed transit, the density mostly decreased since 1950.
![]()
Figure 3. Rapid transit system length and density growth
Without any other factors controlled, the system length of the rapid transit system is not significantly associated with density growth, as shown in Figure 3, but after controlling the population density of 1950, the transit is positively significantly correlated with density increase from 1950 to 2015. The results of the linear regression model are shown in the following table.
Table 1: Regression results (dependent variable: increase of density from 1950 to 2015)
| Estimate | p-value | |
| (Intercept) | 1798.34 | 0.14 |
| rapid transit system length (miles) | 72.54 | <0.01 |
| Population density of 1950 (people per square mile ) | -0.66 | <0.01 |
| R-squared | 0.5279 | |
The results show that cities that started with higher density tended to experience lower density growth. For cities that started with similar population density, the ones that have high-capacity transit system tend to have a bigger density increase, which means the inclusion of high capacity transit may have helped increase/retain density.

Figure 4 Density growth and transit network length
Recent Comments