June 10, 2016
Seattle from the air (and emissions from aviation)

Don MacKenzie
Last weekend, my family and I went on a scenic flight around Seattle, which Kenmore Air was offering free for kids in honor of their 70th anniversary.
Our aircraft was a de Havilland Canada DHC-3 Turbine Otter:
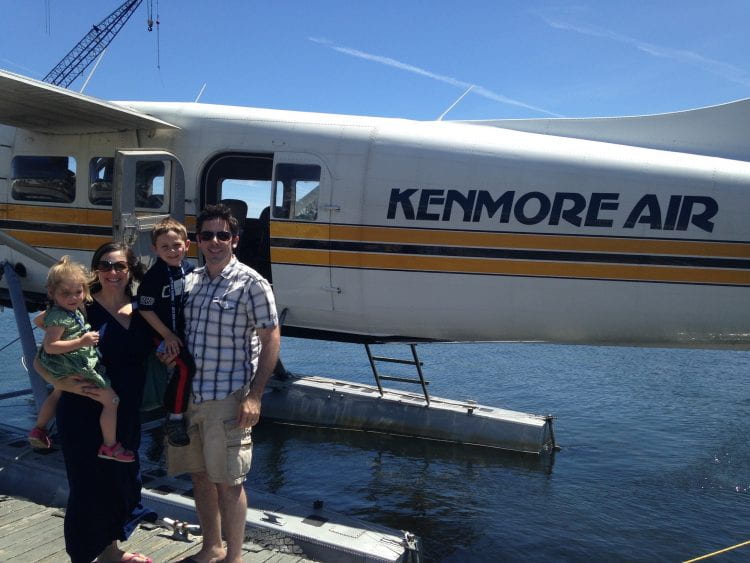
The Otter is known for being a capable and versatile float plane, though perhaps a bit of a “middle child.” It is certainly not as storied as its predecessor, the legendary DHC-2 Beaver, the “half-ton, flying, pickup truck” that has become an icon of the Canadian North and is still in service with Kenmore Air today despite being nearly as old as the airline itself. The Otter is also overshadowed by its successor, the DHC-6 Twin Otter, which is famous for feats like flying to the South Pole in winter and being one of the few aircraft capable of serving Nepal’s Lukla Airport, infamous for its 10,000 foot elevation and 1700 foot runway with a 12% grade.
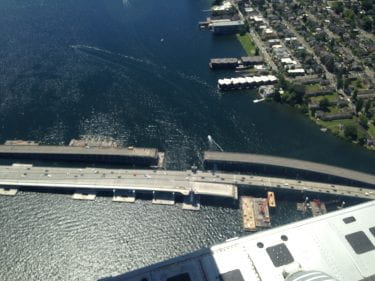
But I digress. We took off from Kenmore Air Harbor a the North end of Lake Washington, and headed south along the lake. We passed the new Evergreen Point Bridge carrying State Highway 520 across the lake:

I also noticed that demolition has begun on the old bridge. Lots of cool transportation projects in Seattle these days:
We turned westward and headed toward Lake Union, North of downtown.

We did a flyby of the Space Needle, with Mt. Rainier in the background.
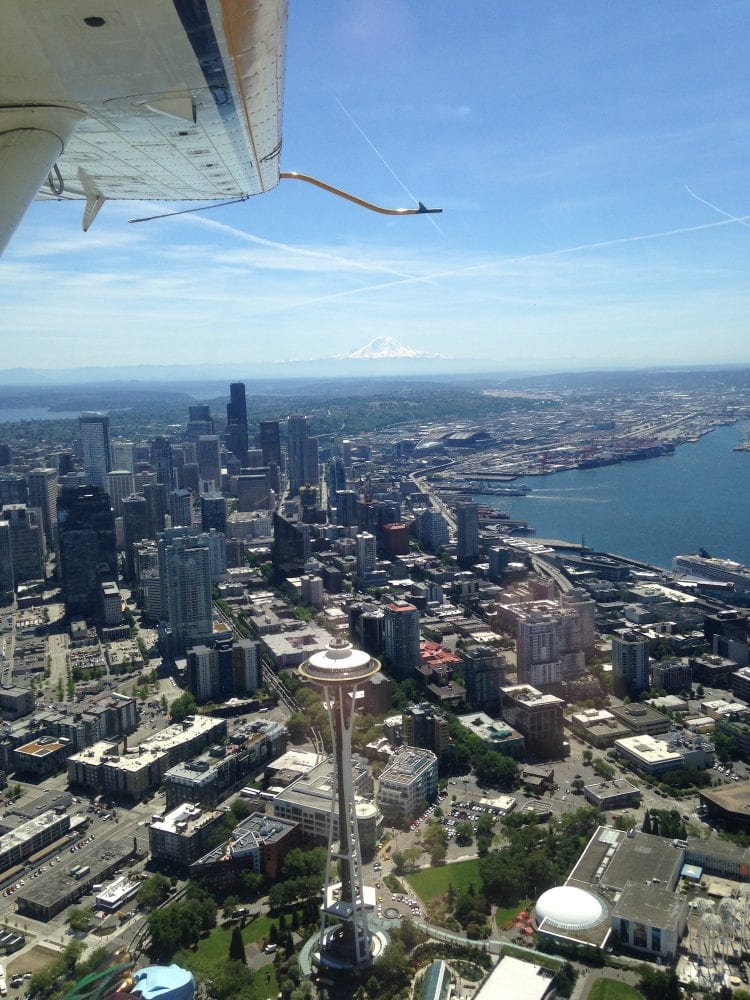
It’s an amazing view but I still think the one from Kerry Park might be better, and easier on the wallet.
We turned around in a broad circle over Elliott Bay, with views of the Cascade Mountains, downtown, the Port of Seattle, and the soon-to-be-gone Alaskan Way Viaduct.
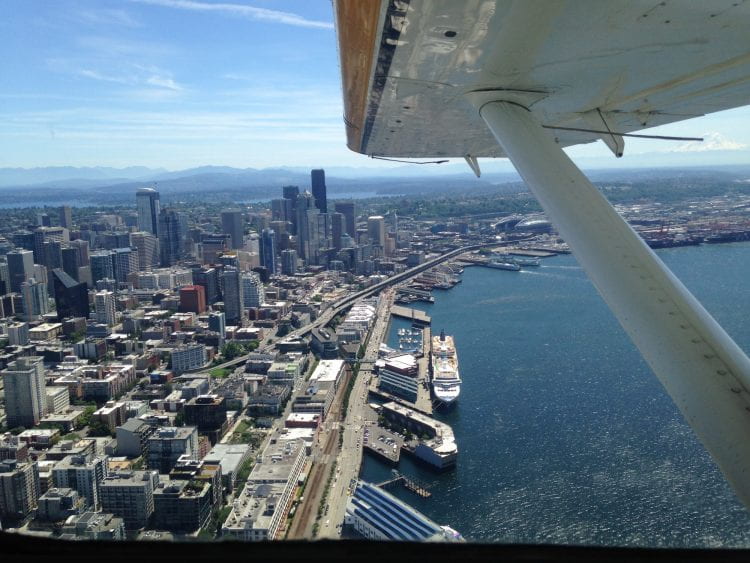
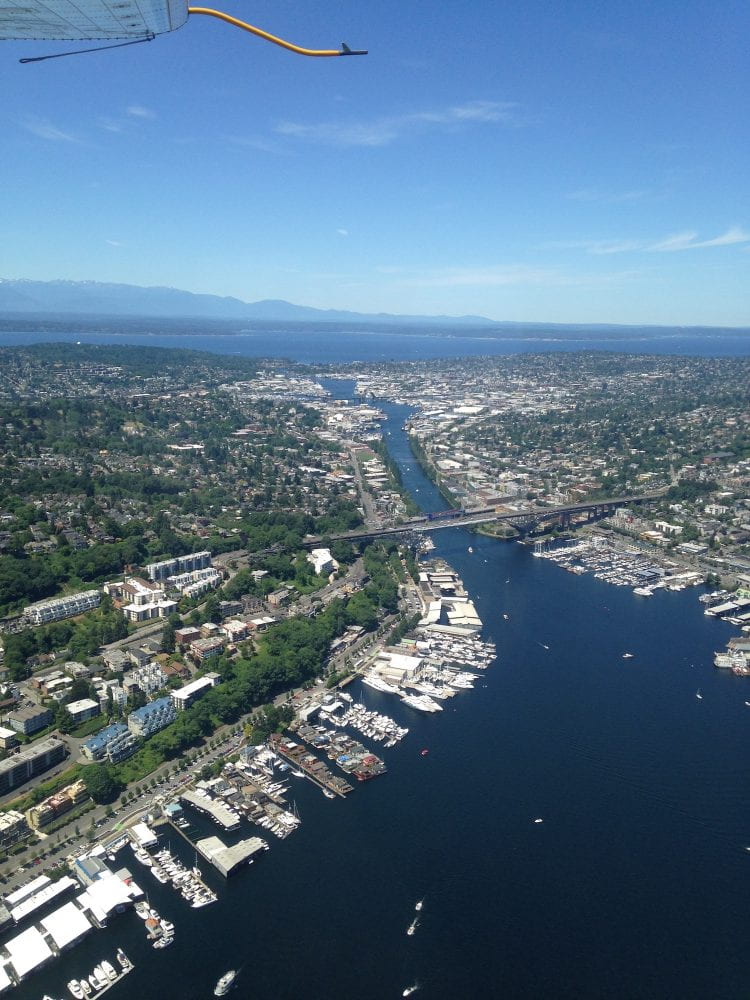
On the way back we were treated to views of Lake Union, the Lake Washington Ship Canal, and the Olympic Mountains…
… as well as the UW’s beautiful campus.

It was a most enjoyable half hour, but it got me thinking: how much carbon did we just emit?
The Turbine Otter uses a Pratt & Whitney Canada PT6A-27 or -34 turbine engine. I don’t know which engine was in our Otter, and I can’t find specific fuel consumption numbers for either of these specific engines, so I’ll assume an engine power of 700 hp and specific fuel consumption of 0.58 lb/hp/hr. Using ICAO time-in-mode numbers (except for taxi in and taxi out, which were extremely short), and assuming 70% power at cruise, I estimate the fuel burn for the flight at about 122 lbs.
| Maximum Power | 700 | hp | ||
| Specific Fuel Consumption | 0.58 | lb/hp/hr | ||
| Seconds | Thrust setting | Power (hp) | Fuel (lb) | |
| Taxi out | 90 | 7% | 49 | 0.7 |
| Take off | 42 | 100% | 700 | 4.7 |
| Climb out | 132 | 85% | 595 | 12.7 |
| Cruise | 1206 | 70% | 490 | 95.2 |
| Approach | 240 | 30% | 210 | 8.1 |
| Taxi in | 90 | 7% | 49 | 0.7 |
| Total | 1800 | 122.1 |
Comparing with a rule-of-thumb estimate of 350 lbs/hour in cruise, this seems a little low for a 30-minute flight. However, this latter source seems to be talking about fuel burn with a full load. With 8 adults and 2 small kids, we were probably not close to the Turbo Otter’s 2800 lb payload limit. So let’s split the difference and assume 150 lbs of fuel burned.
Schäfer pegs the life-cycle GHG emissions of jet fuel at 86 g CO2-equivalent / MJ, and the heating value at 34.7 MJ/l and the density at 811 g/l. Thus, we can estimate the GHG emissions from our flight as
(150 lbs fuel) * (454 g/lb) / (811 g/l) * (34.7 MJ/l) * (86 g CO2-eq / MJ) * (0.001 kg / g) = 251 kg CO2-eq
Split among 10 passengers, that’s 25 kg CO2-eq each, or 100 kg CO2-eq for our family of 4. That’s about the same as the emissions from one (9 gallon) tank of gas in our Honda Fit, which we would typically go through in a week. It’s a bit frivolous, I suppose, but not as bad as I would have guessed. It was a lot of fun to see the Emerald City from the air, and (to rationalize more than a little) it’s still not nearly as outrageous as space tourism.
Recent Comments