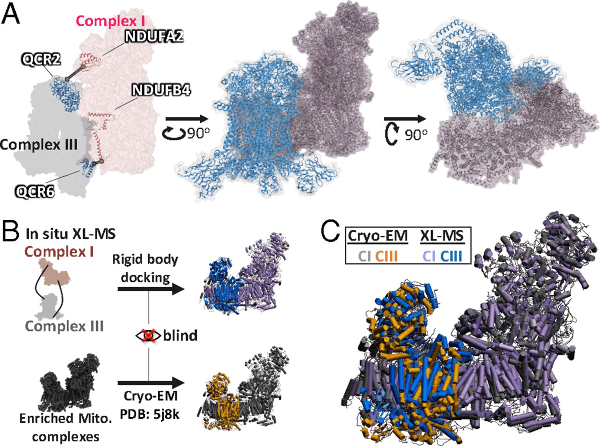
Mitochondria play a critical role in the pathology of chronic diseases and aging due to their status as the primary link between energy metabolism, oxidative stress and control of cell signaling. The complexes of the electron transport system are typically illustrated as a linear chain in the mitochondrial inner membrane (cristae). However, it is now recognized that the complexes are organized into larger supercomplexes or respirasomes. These respirasomes are hypothesized to facilitate efficient electron flow through the respiratory chain. Disruption of these interactions is thought to underlie changes in mitochondrial function associated with disease as well as exercise. Thus, a better understanding of the specific molecular interactions will provide new insights into the mechanisms of disease as well as the potential to develop more targeted interventions. Scheppe et al used a state of the art chemical cross-linking approach to identify the interactions of the mitochondrial proteome. Nearly 2500 cross-linked pairs of peptides were identified from over 300 mitochondrial proteins involved in oxidative phosphorylation and the structure of the mitochondrial cristae membrane. These cross-links confirmed the existence of the respirasomes and identified the specific molecular interactions between complex I and III of the ETS. The interactions identified by Schweppe et al using chemical cross-linking (XL-MS) were in close agreement with protein structural data (Cryo-EM) (see figure). The database of mitochondrial protein cross-links established by this study will provide a novel and invaluable tool for investigating the structural basis of mitochondrial dysfunction in disease and facilitate development of more specific targeted interventions to reverse mitochondrial dysfunction.

Determination of supercomplex structures from functional mitochondria. (A) Supercomplex model from rigid body docking (59) of complex I (NDUA2, NDUA4) and complex III (QCR2, QCR6) using cross-linked peptide distance constraints (NDUA2–QCR2; NDUA4–QCR6). Complex I is shown in pink, and complex III is shown in blue. Ribbon models of intercomplex cross-linked proteins are shown within the surface model in the left panel, and the distance constraints used are displayed as gray lines. (B) Workflow for the comparison of a recently published cryo-EM structure (PDB ID code: 5J8K) (21) and the XL-MS–based supercomplex model. The XL-MS–based model was generated without prior knowledge of the cryo-EM model. (C) Comparison of the in situ XL-MS docked supercomplex with the cryo-EM supercomplex model (PDB ID code: 5J8K). Structures were aligned based on complex I. Complex I rmsd = 1.3 Å; complex III rmsd = 2.4 Å.