A Closer Look at the Wrackline

The presence and composition of wrack (the seaweed and other material washed in on high tide) varies from beach to beach, day to day, and season to season. Looking through the kelp, crab molts, wood chips, or Velella velella that wash in provides a dynamic and fascinating window into the world just offshore.

Wrack piled high and in big lumps can obscure the likelihood of finding what we look for during COASST surveys. That’s why COASST keeps track of the proportion and continuity of beach zones, and in which zone birds or debris are encountered. With this information, we can better estimate the quantity of what washes in.

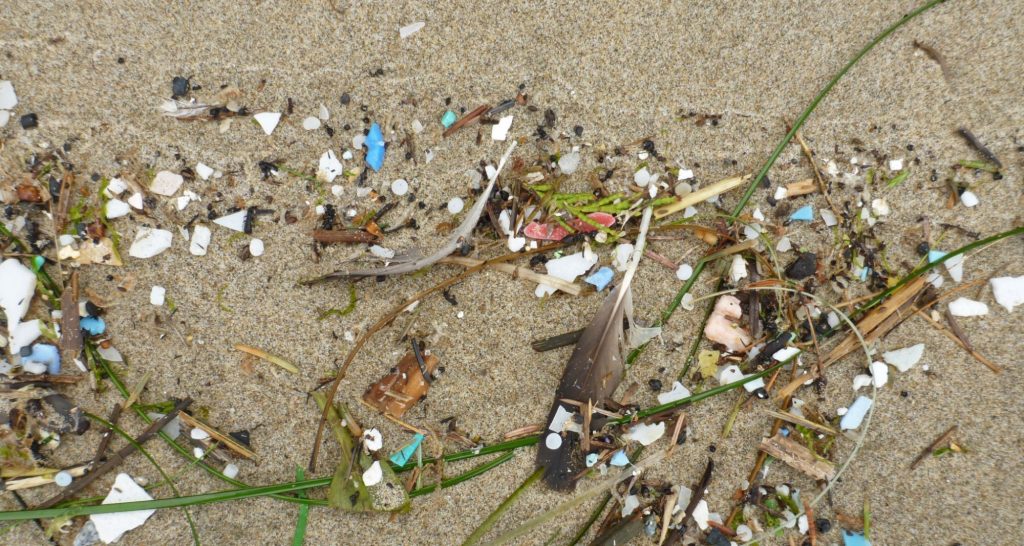
fir needles, feathers, plastic nurdles and fragments

So what’s in the wrack zone anyway, and how does it get there?

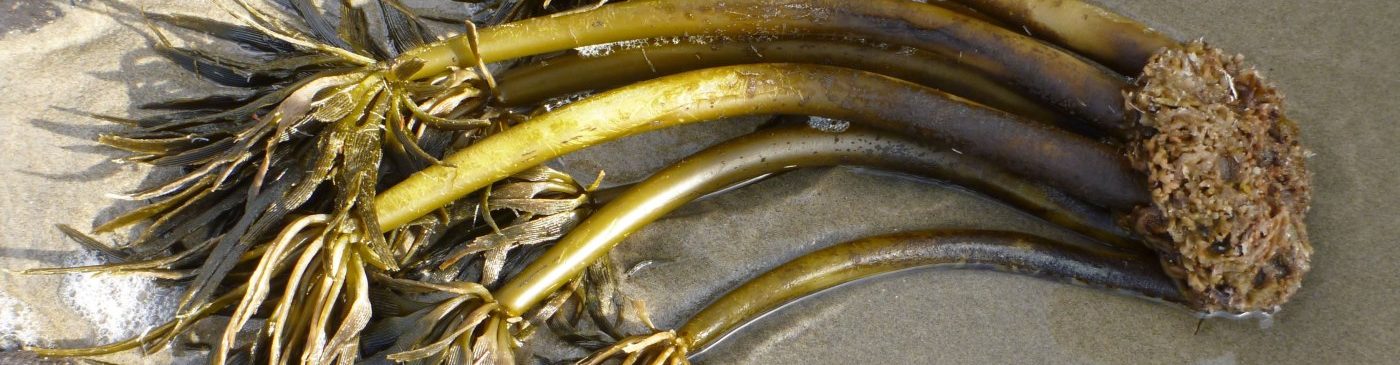
Much of what we find once grew and lived in the ocean. Macroalgae (seaweed) includes species that either float freely or are anchored to the seabed. The latter can be broken by waves during high energy storms, freeing it for transportation onshore by wind and tides.

Other material that ends up in the wrack lives or has sunk to the seabed, such as crab molts. Large waves can disturb the seabed and refloat these objects, which are then transported onshore. This is why wrack is thickest, and often contains the most variety, after large winter storms. At certain times of year, the wrack zone may also consist of a thick band of Velella vellela, the result of onshore wind that pushes these “by-the-wind sailors” onto beaches.

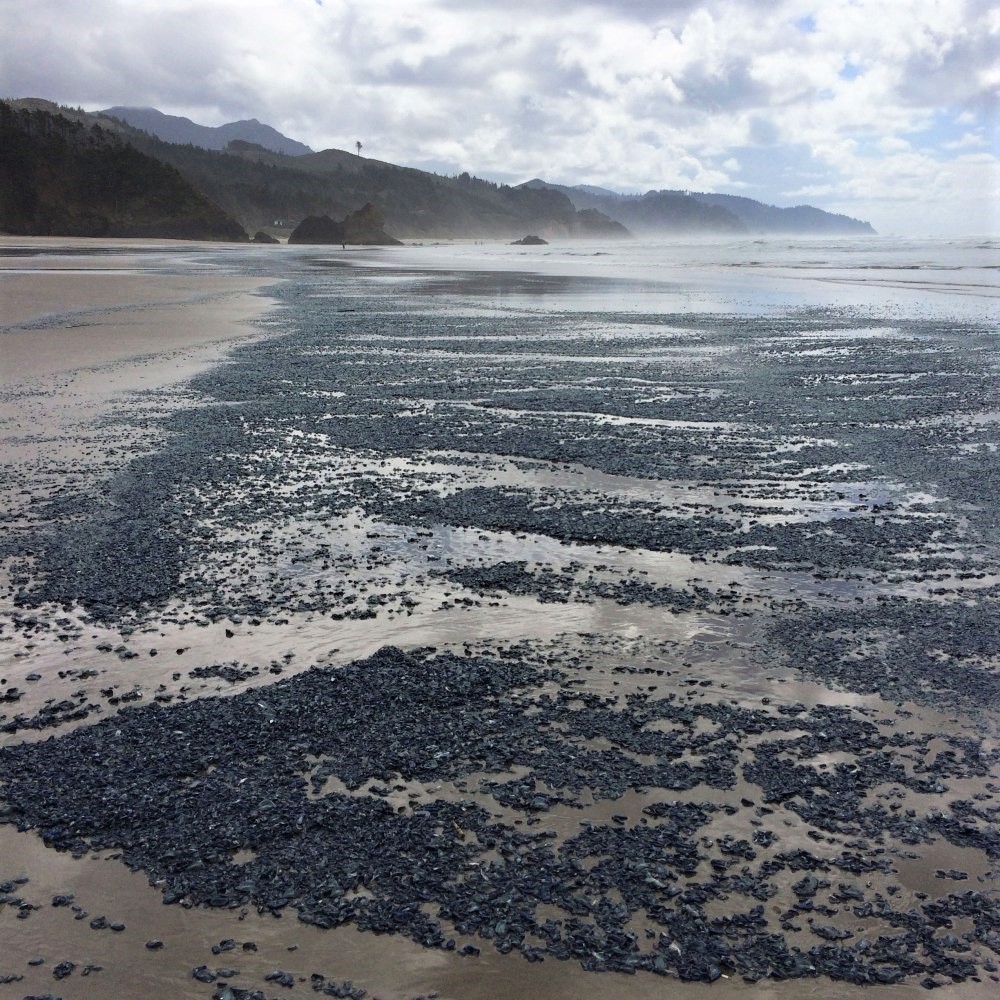
Velella velella, by-the-wind sailors

As wrack decomposes, it can stink. But it also provides the building blocks – nutrients and substrate – for the dune grasses that stabilize our beaches and provide habitat for nesting shorebirds. Additionally, it provides habitat and food for invertebrates like insects, crabs and sand-hoppers, species that are in turn eaten by birds and other critters up the food chain.

Clumps of wrack are surrounded by a cloud of beach hoppers. Yet, high-use tourist areas sometimes remove wrack, to the detriment of abundance and diversity of beach flora and fauna.

Here are a few of the species that COASSTers encounter in the wrack zone:

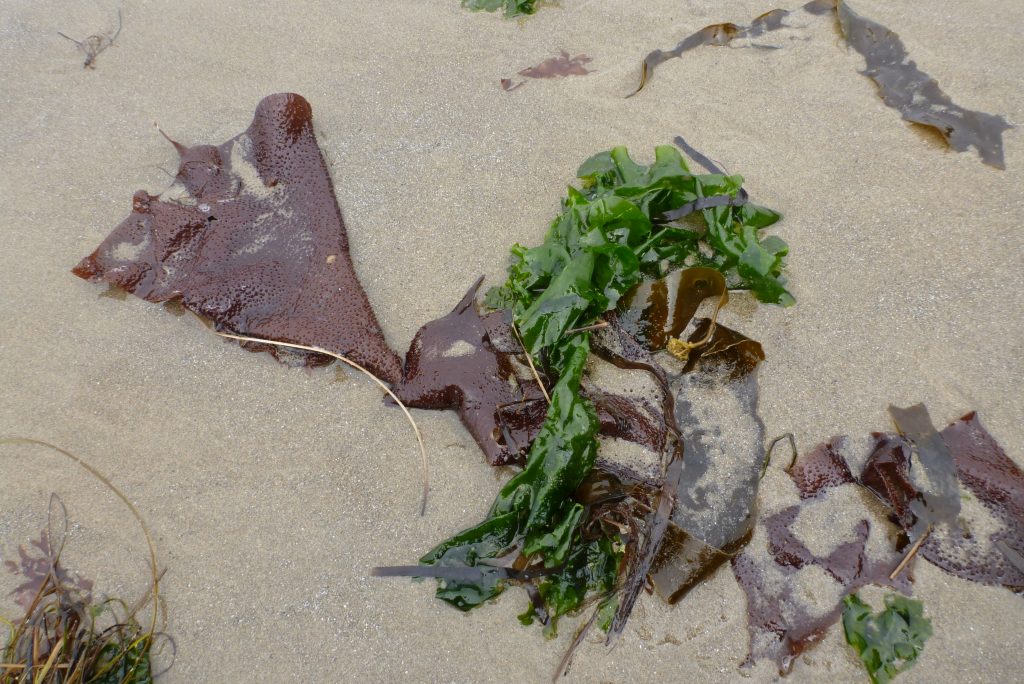
Gigartina exasperata, Turkish towel

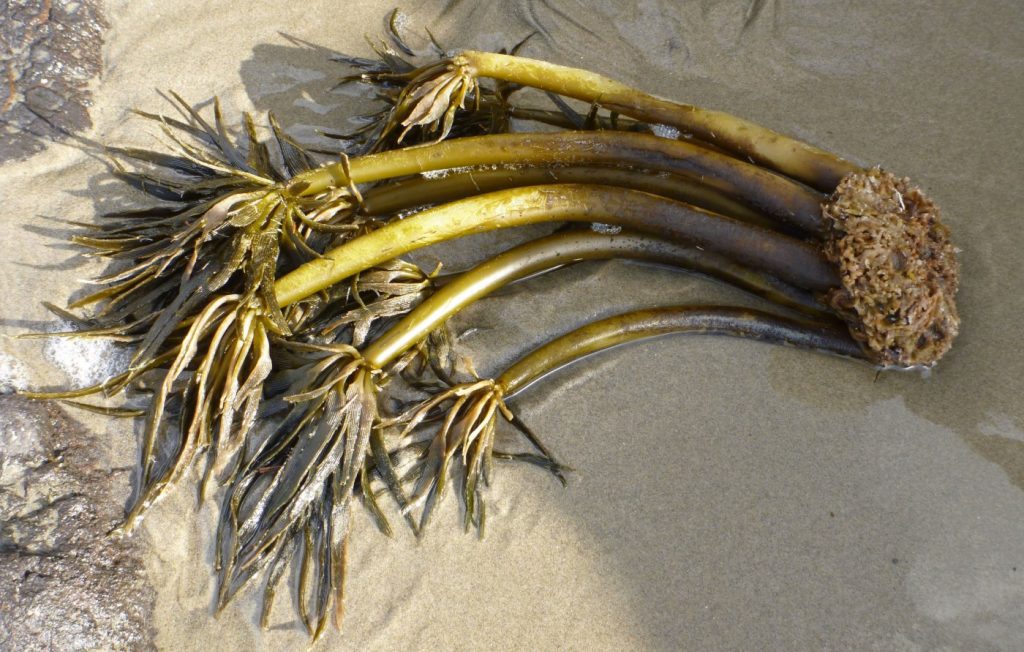
Postelsia pamaeformis, sea palm

Zostera marina, eelgrass


Special thanks to Steve Morey, of theoutershores.com for sharing his beautiful photos with COASST. To see more of Steve’s photos of what washed into Oregon beaches, visit his website.

Unsolved Mysteries – May 2017

This object was recorded as part of a COASST Marine Debris survey at Sunset Beach in Oregon. The text on the yellow label translates to “Warning! Sealed!” Do you know what it is? Perhaps the serial number is a clue.

If you have any ideas, please let us know your thoughts in the comments below, or send us an email at coasst@uw.edu.


The Risk of Chronic Oiling

When Michael, one of our new COASSTers, found oil on his survey at Jacobsen Jetty South (Tokeland, WA) last month, we decided to take a closer look at the oiled birds in the COASST dataset. How many oiled birds has COASST found over the years, and where? What is the risk of chronic oiling, the type of oiling that might result from small spills like the one Michael documented?

Since 2000, COASSTers have documented 125 oiled birds: 3 in California, 4 in Alaska, 15 in Oregon and a whopping 103 in Washington. But absolute numbers don’t tell the whole story! There are also a lot of unoiled birds found along the outer coast of Washington. To generate an index of chronic oiling risk, we divided the number of oiled carcasses found by the total number of carcasses found, per state. Washington is still in the lead, but Alaska is now second!

Oiling rate by state (separating out Salish Sea and Outer Washington locations) with higher rates indicative of relative risk of chronic oiling, regardless of how many carcasses have been found overall. This analysis allows direct comparisons between birdy states, like Washington, and states like Alaska where the chance of finding a beached bird in some locations is basically zilch. (For the statistically-minded, we’ve subtracted the mass mortality events out of the baseline signal, so we’re truly comparing baseline to oiling).

What’s the story in Washington? Why so many oiled birds relative to elsewhere (3 times higher risk than Alaska, 6 times Oregon and 11 times California)? The map below indicates that almost all of the oiled birds found by COASSTers in Washington have been along the outer coast (only one oiled bird has been found in Puget Sound, just at the entrance of Admiralty Inlet), and most of those have occurred on the Long Beach peninsula and in the Gray’s Harbor/Ocean Shores area. A second smaller cluster of oiling can be seen on the beaches immediately south of Cape Flattery. We suspect a combination of shipping activity concentrated at the Columbia River and at the entrance of the Strait of Juan de Fuca, boating activity in the vicinity of the two large southern estuaries, and coastal oceanography bringing Columbia River water close to shore along the southern half of the Washington coastline (but not the Oregon coastline).

What washes in oiled and where in Washington, the state with the overwhelming majority of oiled carcasses (82%) COASSTers have found. Jacobsen Jetty South, where Michael recently reported an oil spill, is right in the middle of the highest oiling region, the southern outer coast. Circles are scaled to the number of oiled birds found – a few beaches are approaching 30 oiled carcasses, in total!

What washes in oiled and where in Washington State – the state with the overwhelming majority of oiled carcasses (82%) COASSTers have found. Jacobsen Jetty South, where Michael recently reported an oil spill, is right in the middle of the highest oiling region, the southern outer coast. Circles are scaled to the number of oiled birds found – a few beaches are approaching 30 oiled carcasses, in total! Of course, the spill Michael encountered at Jacobsen Jetty South reminds us that chronic spills are not necessarily the result of a vessel actually discharging oil, or oily bilge water, but can be the result in inadvertent loss of oil-filled containers, or even malicious dumping once the debris reaches shore. Although large oil spills get most of the press, the vast majority of spills in any year are small ones. One study released by the Washington Department of Ecology showed that between 1991 and 1996 there were 100 documented oil spills. Only 4 were large (>100,000 gallons). Half were 100 gallons or less, and three-quarters were 1,000 gallons or less.

And finally, which species are oiled? Not surprisingly, murres, fulmars and gulls top the list, accounting for ~80% of all oiled carcasses found. We’re not surprised by this because murres, fulmars and gulls also collectively rank as the top three species or groups in the COASST dataset. In fact, there is a pretty strong relationship between oiling numbers and total numbers. The only species that falls outside of this relationship is Black-footed Albatross. At 186 Black-foots found to date, we’d not expect to see even a single oiled carcass, let alone two.

Wondering what to do if you find a fresh oil or hazardous material spill on your beach? Check out this post for details on how to make a report!

How do you report an oil spill?

On April 5, 2017, Michael started his very first beached bird survey on Jacobsen Jetty South near Tokeland in Pacific County, WA. April is usually a quiet time of year for COASST and COASSTers, with few beached birds other than the occasional Common Murre. However, in Michael’s first survey he literally found a smoking gun – a small oil spill on the beach. Fortunately, he had the presence of mind to document the spill with careful photos and description, which were transmitted to the COASST office, and from us to the WA Department of Ecology, the state agency in charge of handling these types of spills.

Photo Credit: M. Heikkinen

Dave Byers, the Oil Spill Response Section Manager at the WA Department of Ecology, informed us that two spill responders were dispatched to investigate and size-up the scene. Due to the large amount of oiled sediment and debris, Ecology hired a clean-up contractor to respond, remove and safely dispose of the contaminated material. Here they are in action!

Photo Credit: WA Dept of Ecology

The spill responders believe that the oil was from a waste-oil container that was tossed or washed overboard from a vessel.  It also appeared that oil from the container was intentionally emptied on the beach after the container washed ashore. It’s very lucky that Michael was there to document and report, and it’s a great reminder to always proceed with caution if you find a chemical container.

What should you do if you find a fresh oil or hazardous material spill on your beach?
Dave Byers at the WA Department of Ecology suggests documenting your location, the type and approximate volume (or areal spread) of oil, distance from the water, and what coastal resources are impacted by the oil. As always, carefully photo-document!! You can also use the COASST protocol for oiling (page 2-11, protocol version 3.0). All of this information will help authorities determine what resources are necessary for responding to the incident.

Any of the numbers below can be used to report the spill:

  • 1-800-OILS-911 works anywhere along the coast of North America.  It is a 24-hour hotline which will recognize where the call is originating and connect with the appropriate state or province Emergency Management Office.  This works in Alaska, British Columbia, Washington, Oregon and California.
  • 1-800-424-8802 connects you to the U.S. National Response Center. Information taken from callers is passed to the appropriate state and federal response agencies.
  • 1-800-258-5994 connects you 24/7 to Washington Emergency Management which serves as the after-hour dispatcher for Ecology Responders.

And of course, you can always call or email COASST, and we will also pass on your information.

Silent Winter

All quiet on the western front? Lower 48 Outer COASSTers, and our data verifier Charlie Wright, have – after breathing a huge sigh of relief! – been reporting that it’s been a little too quiet this winter. In fact, COASST surveys from November 2016 to February 2017 from Washington down to California recorded the lowest encounter rates of beached birds we’ve seen since we started!

The “heartbeat” graphs below show the long-term (starting in 2001 for WA and OR; 2006 for CA) baseline (solid black line) and a measure of variability around it (yellow wash). The gray bars are the average monthly values for that region of the coastline. We’ve rolled up the COASST data by state, so realize that there are a lot of beaches represented by each bar.

In this graphic, it’s easy to see the recent mass mortality events – these are the gray bars that are way over the baseline (and just a note for the statistically geeky – COASST deletes all of the mass mortality event months, which we define as more than 4 times the baseline, from the baseline calculation).

But check out what’s been happening most recently. We’ve expanded the last four months and displayed them as a percent of the baseline. Only December in Washington and February in California reach ~100%. All other region-month combinations are at less than half of the number of birds we would expect over the same period. Of course, compared to the death and destruction of recent winters along the outer coast, too few birds doesn’t ring alarm bells. But we have been wondering, who is missing?

The bar graph indicates the number of carcasses, by species or group, in a 100 kilometer stretch across the entire lower-48 outer coast. The blue bars are the baseline encounter rate, (statistical geeks take note: calculated as the median across years from 2006 on so that WA, OR and CA are equally weighted). No surprise – fulmars, murres (within the large Alcids), large grebes (mostly Western Grebes) and gulls make up the vast majority of the “usuals.”

The red bars are what is happening this winter, from Nov-Dec 2016 in the top panel, to Jan-Feb 2017 in the bottom panel. With some exceptions (check out Northern Fulmars, phalaropes in November-December and kittiwakes in January-February), most groups are drifting in at lower rates. We’ve boxed “top 5” contributors that have dropped this year by more than half. Large Alcids – mainly murres – were much less abundant than usual, with rates ten times below normal for January-February. Rates for gulls, cormorants and small Alcids (primarily Cassin’s Auklets) were also much lower than normal.

Both large and small Alcids have been having a rough time recently, with significant mortality events effecting Cassin’s Auklets in the winter of 2014-15, Common Murres in the winter of 2015-16 and Rhinoceros Auklets in the summer/fall of 2016. In fact, this is the first winter in three years that lower 48 outer coast COASSTers haven’t responded to a major die-off event.

Where post-breeding birds disperse to is an important factor in determining whether and how many will end up on shore. Should they die in a winter storm, birds that have taken up their wintering residence far offshore have little chance of floating to the beach before they sink or are scavenged at-sea. This is usually the case with Cassin’s Auklets, as geolocation tagged birds have ranged throughout the eastern half of the North Pacific in winter. Undoubtedly, some of the birds are simply way out there.

But the simplest explanation is that fewer birds are dying. Across the board declines in the rate at which COASSTers are encountering carcasses is usually indicative of milder conditions, and/or plentiful food. The winter storm conditions were fairly average compared to the long-term average, and with ocean temperatures approaching near-normal levels off of the whole of the west coast by late 2016, conditions may finally be returning to some level of normalcy.

Should we be worried about the lack of dead birds on beaches? With the tumultuous last several years, COASST has come to expect a “new normal.” Whether that now includes a return to the “wreck years” is an open question. In the meantime, COASSTers should relax into their next survey and enjoy the respite!

Photo Credit: S. Beck

Unsolved Mysteries – February 2017

These objects have washed in as part of COASST Marine Debris surveys.  Do you know what they are? If so, we’d love to have your help! Please let us know your thoughts in the comments below, or send us an email at coasst@uw.edu.

Michael and Laura found this red plastic part at Edmonds Marina in Washington.

This (part of the Millennium Falcon?) was found on a wilderness beach in Olympic National Park in Washington by Chiggers.

This large and heavily worn object was found by Sean and Becky at Beachside State Park in Oregon.

Grebe Time

COASSTers surveying along the Lower 48 West Coast know that winter brings cold, darkness, rain… and grebes. This winter season, COASST has received a flurry of messages about an uptick in beachcast grebes. Is this normal? Is something going on? The answers are yes, and yes.

Grebes breed inland on freshwater lakes and ponds throughout western North America, migrating to coastal locations post-breeding from the Gulf of Alaska south to Mexico, and including inside waters like the Salish Sea, San Francisco Bay, and the Gulf of California. By November, the chance of encountering a grebe along the Pacific Northwest outer coast has risen from essentially zero to about one grebe per 5 kilometers. And that’s the average, some places and some years see much higher spikes.

The black line traces the average or “baseline” pattern of how many grebes are found per kilometer of beach length over the year (where numbers less than one mean you would need to walk more than a kilometer to find a grebe). The yellow area to either side of the line is the range over which 95% of the actual variability in that central signal lies. If we record a month and year that is absolutely lower (or higher) than the yellow area, we pay attention.

Most of the grebes washing ashore on COASST beaches are large grebes, and most of those are Western Grebes. The pie charts in the map graphic indicate the proportion of grebes found in each region identified to species. Dark blue is Western, turquoise is Clark’s, and light blue is when we can’t tell the difference.

What?!? Are we really that bad at identification? Nope. Turns out that a headless large grebe is impossible to differentiate as Western or Clark’s. And that’s because the best character is whether the dark|light plumage line on the face puts the eye in the dark feathers (Western) or the white feathers (Clark’s).

Side note: headless grebes, or more commonly a grebe with the neck skin inverted and pulled over the face so that only the bill is poking out from this macabre inside out turtleneck are the victims of raptors who literally skin their dinner to expose the breast meat. Light blue pie slice? – that’s a raptor signal.

There are several really cool patterns to note in this graphic:

  • First, the proportion of the grebe pie that is Western or Clark’s is HUGE – almost every grebe found along the outer coast is one or the other.
  • Second, the “raptor signal” is also pretty large, especially in California.
  • Third, the chance of finding a beachcast grebe is vastly different, depending on where you are. From November-February (i.e. the peak season for Grebes) you need only walk ~3 km in California to find a grebe on average, whereas in Puget Sound it’s a much longer trek: 115 km of beach before finding a grebe. And there’s a south to north pattern – more towards the south, less as you go north, and a serious decline as you round the corner into the Salish Sea.
  • Fourth, while the Salish Sea may not have as many grebe carcasses on beaches, the variety – the biodiversity – of grebes is much higher. Horned Grebes, Pied-billed Grebes, even Eared Grebes wash in. Want a chance of finding a Red-necked Grebe? Eschew the outer coast and head for the Strait of Juan de Fuca.

When the days start to lengthen and winter loses it’s grip on the Pacific Northwest, grebes stop washing in. By March-April, a grebe carcass is a very rare occurrence on a COASST beach. And that’s because these long-necked divers have left their seaside wintering grounds for their freshwater breeding sites, where they’ll build a floating nest, raise a brood, and start the migratory cycle all over again.

Happy Holidays from COASST!

It’s amazing to us that we’ve zoomed through another year!  In fact, COASST is approaching our 20th year (if you count from the year of our first grant – 1998), and we’re stronger and better than ever.

Those decades have seen real changes.  We started with 12 pilot volunteers in Grays Harbor, Washington, before we had a protocol or a website, before our field guide was invented, and long before our office filled with students, staff and science collaborators.  Who knew that we’d last so long, grow so large (over 800 participants this year alone, and more than 3,000 trained since we started), or be able to contribute to so many fundamental issues in coastal ecosystem health and science?

Today, we are one of the most well-known citizen science programs delivering top notch science to the research and natural resource communities, and – importantly – back to the coastal communities from which all of our data come.  In fact, our model of citizen science – from our trainings to our data verification to our data visualizations to our holiday card (!) – has become the gold standard.

So hats off to all of you!  Without your passion for your beach, your love of the natural world, and your curiosity regarding how the coastal environment is changing (for better or worse), COASST wouldn’t exist.  This holiday season, bundle up and take a walk on your beach to celebrate our collective achievement, and remember there are hundreds of people like you in dozens of coastal communities up and down the West Coast of North America doing the same thing.

Happy Holidays!

Julia, Erika, Hillary, Tim, Charlie, Katie, and the COASST Interns